Introduction to Residential Electricity Rates
This is the first of a sequence of posts exploring the structure of residential electricity rates in the U.S.
The project was inspired by a conversation I had with a friend who lives near San Diego, California. Owning an electric vehicle, he was keenly aware of the cost of using electricity (in cents per kWh) at different times of the day (he also sensibly only turned on the air conditioning in his house after 9pm).
I realized I knew very little about this market, and so this began a quest to collect data both about what individuals pay for electricity and why, but more importantly how these systems are designed and what incentives they create. On system-wide aggregate supply and demand considerations, and the high level tools that utilities have to ensure that supply and demand balance, I recommend Patrick McKenzie’s write-up here.
This project starts with a much more humble look at how prices to consumers are structured.
Fixed vs. Time of Use
The historically dominant rate structure for electricity is fixed rate – customers are billed a constant rate (usually between 10 and 50 cents, depending on the state) per kilowatt-hour (kWh) used in a month. Most jurisdictions also charge either a flat monthly fee or monthly minimum usage charge.
More recently, utilities have rolled out (and, in the case of many areas of California, established as the default, Time of Use (TOU) plans, where households pay a rate per kWh that depends on the time of day and sometimes the time of the year when electricity is used. By one estimate, about 15% of American households are (or will soon be) on TOU plans.
The general purpose of TOU plans is to provide incentives to align electricity demand with the cost of production. In particular, they seek to induce customers to shift their demand for electricity away peak usages times which stress the total supply of electricity. Ofthen these times are afternoon / early evenings, especially in summer months in warmer climates.
Some Examples
The first examples we’ll start with are Nevada and Connecticut (where I have paid electricity bills) and Maryland (which is also simple a few interesting differences from CT).
Nevada (NV Energy, Southern Nevada)

A few observations:
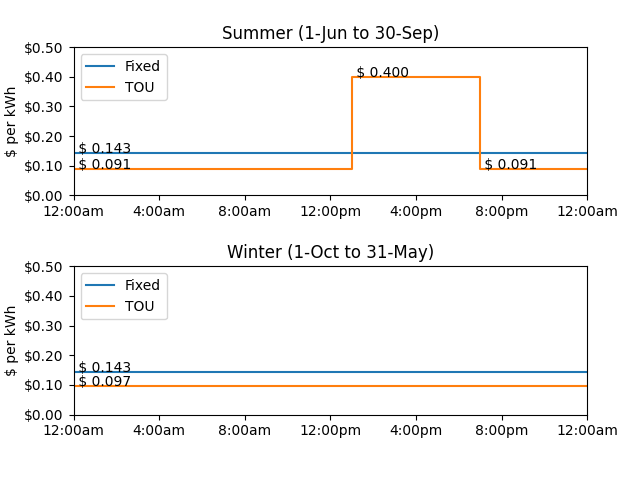
- A large price differential between peak and off-peak. Peak pricing is 4.4x off-peak, and 2.8x the fixed rate.
- Winter is 100% off-peak
- As we’ll see when we compare to other places, Nevada electricity is reasonably cheap.
Although the time of production of certain renewable sources is sometimes cited as a cause for concern in grid management, this doesn’t seem to be a major factor in Nevada. More than 10% of Nevada’s electricity generation is solar (which might suggest electricity is more plentiful in summer periods from say 10am to 3pm, and is less plentiful in winter and in late afternoon / evenings), but timing of peak vs. off-peak periods is not aligned to that supply. It appears that the TOU plan in Southern Nevada is mostly abount managing air-conditioning-driven customer demand in summer.
Connecticut (Eversource)

By contrast:
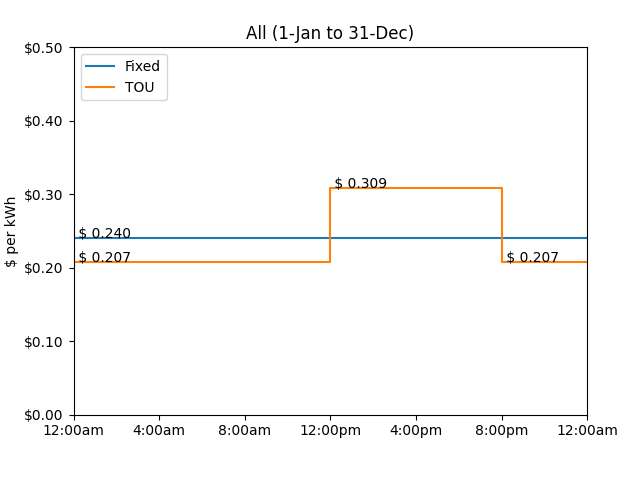
- Connecticut electricity is more expensive than Nevada - roughly 2x per kWh.
- The TOU plan provides rather small incentives to shift demand: peak pricing is only 1.5x off-peak and 1.3x the fixed rate price.
- Winter and summer have the same peak vs. off-peak profile.
It’s unclear to me whether these patterns are actually driven by the demand profile of Connecticut electricity usage. It is possible that
the less extreme summer climate means the HVAC differential between summer afternoons and all other times is
less severe than in Nevada or other warm states, making overall demand much smoother.
Alternatively, there may be a more conservative consumer / regulatory culture that is retains more attached to fixed-rate plans.
Maryland (Baltimore Gas & Electric)

Maryland is largely similar to Connecticut, with a few modifications:
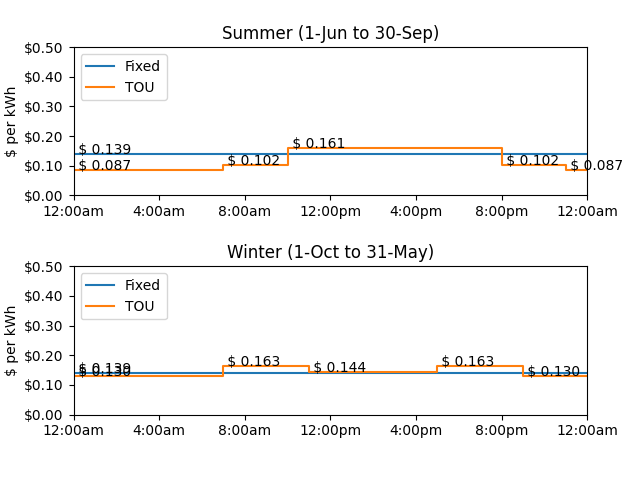
- Overall, electricity is cheaper
- This TOU plan also has smaller price incentives: the peak summer hours are 1.9x the off-peak and 1.2x the fixed rate
- Winter and summer peak pricing kicks in at different times of day: the summer peak pricing (following maximum air-conditioning demand) is from noon to 8pm. Winter has two peaks – one in the morning and one in the evening. This presumably corresponds to when residential customers are up and at home in the morning and in the evening, making maximum use of appliances and probably to some extent electricity-based heating and water heating.
- BG&E has an intermediate peak pricing tier – for shoulder periods around the peak in the summer, and during the middle of the day in winter between the two peak periods. This is just one example of a number of plans (especially those with especially low overnight pricing for EVs) with three pricing times rather than two.
Other Structures Later
There are a variety of other pricing structures in the market:
- Tiered structures - in which customers are charged different prices based on their aggregate kWh used during the month (i.e., increasing price with usage)
- Peak demand structures - in which customers are charged more based on the highest rate of electricity use during the month (i.e., if the maximum use during any point in the month is 50kW vs. 30kW there is an incremental cost to that, even with the same aggregate use).
- Floating critical peak structures - a variant on TOU plans where the utility has the ability to declare (usually with some advance notice) that a particular time period (e.g., the afternoon hours of the next day) are expected to be especially demand heavy. These are then priced at levels ABOVE typical peak pricing; with the tradeoff being that off-peak hours are lower price.
- Special pricing plans for Electric Vehicles
These structures add complexity, and as such were more challenging to capture in the simple spreadsheets I am currently using as my database =). We’ll get to these later.
Github repo
In-progress data (manually sourced by looking at different utitlity websites) and code to analyze is here.