Hello, world! This blog will be a forum for me to explore topics that can be addressed with data, assisted by code. It is as an opportunity to learn about interesting substantive topics about how the world works, beginning with the energy market in the U.S. Conversations always welcome.
AI and Data Centers Driving Electricity Growth: A Look at Virginia
19 May 2024
Electricity demand in the U.S. has had near-zero growth for the last several decades. According to a Goldman Sachs report, “US annual power generation over the past 20 years averag[ed] less than 0.5% growth.” In recent months, utility reports and media coverage have proclaimed a shift towards resumed electricity growth. This is attributed primarily to growth in data center installations, which has been accelerated by data-intensive AI applications, along with other electrification initatives including electric vehicles and electric heating. The Goldman Sachs report, for instance, forecasts 2.4% annual growth through 2030.
This post collects utility scale data that this acceleration is not only in the future, but has already started to occur. Virginia, home to half the data center market in the U.S., has already seen electricity demand average year-over-year growth rates close to 4% since 2019, compared to near zero for neighboring regions. This demand growth in Virginia approximately tracks the increase in data centers there.
Impact of a New Nuclear Plant on Carbon Emissions
3 December 2023
It has been common in recent years to see commentary nuclear power plant closure results in increased electricity generation by fossil-fuel buring power plants. Examples include the 2021 shut-down of Indian Point in New York State, and the 2023 closure of Germany’s three last operating nuclear plants which left the country’s generation footprint as being among the most carbon-intensive in Europe.
This article explores the impact on fossil-fuel burning electricity generation around a similar natural experiment in the other direction: the activation of the Vogtle 3 nuclear power plant in the U.S. state of Georgia on July 31, 2023.
Winter Solar Power is a Two-Humped Camel: Math Really Works
20 August 2023
The graph below shows Nevada’s utility-scale solar generation by hour of the day, for each month. This post uses math (trigonometry and linear algebra) of solar angles and the physical attributes of utility-scale solar panels to explain the funny shape of the curves.
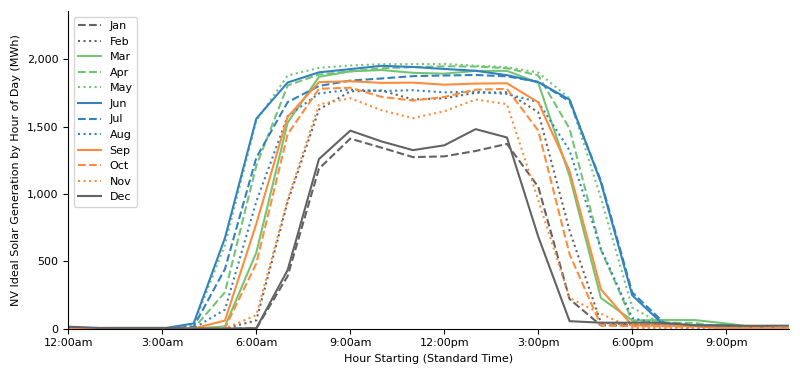
Two features are notable:
-
Long hours of consistently high output in summer rather than a sharper midday crest. Of the roughly 14 hours per day of production in June, 10 of those are at least 90% of the peak: the intensity drops off only during the two hours after sunrise and two hours before sunset.
-
The “dip” in mid-day in winter months. The best solar generation does not occur when the sun is highest in the sky at mid-day, but in peaks before and after.
As we’ll see, the data is consistent with single-axis solar tracking panels adjusts the position of a solar panel along one axis of rotation (i.e., east to west) to make the sun’s rays strike the panel as close to perpendicular as possible. By pointing east in the morning, rotating to be horizontal at mid-day, and then pointing towards the west in the afternoon, a tracking panel can lengthen the period of time that the sun’s rays strike at a near-perpendicular angle to the panel.
In the winter, the two-humped shape occurs because the sun is overall quite low in the sky. In the mid-day the sun is in the south. The best the panel can do is to be horizontal, but the sun is so low that the angle of incidence is far from perpendicular. Better angles – and more electricity generation – occur in the morning and afternoon when the sun is further east or west. This dip does not occur in the summer because the sun is high enough in the sky that a horizontal panel still has a close-to-perpendicular angle at midday.
The strong hours in the summer are particularly long because the sun rises in the north-east, and gets to due east around 9:00 a.m. (8 a.m. standard time). At this point an east-west orientation can point a panel directly at the sun. Ih the afternoon, the sun gets to due west around 5:00 p.m. (4 p.m. standard time). So the hours where the panel can get a nearly-perpendicular angle to the sun span more than this 8-hour period.
There are more subtle features of the generation chart that are less intuitive. First, the maximum generation generation months do not appear to be symmetrical around June (the month with the most daylight hours), but instead appear skewed towards the spring: April and May see more solar generation than July and August. It’s not obvious why this would be the case. In addition, the darkest winter months of December / January seem to be particularly low-generation outliers (i.e., November and February represent big steps-up in generation).
This post, by deploying a simple conceptual model of the physics and math of solar panels, explains these phenomena. Let’s dig in.
Demand Pricing
28 May 2023
In this post I return to the electricity pricing in the U.S., this time focusing on a concept that absent for most residential customers but mandatory for business customers that exceed a certain size: demand pricing. Under a demand pricing scheme, an electricity customer is charged in two separate ways:
(1) Consumption: Energy. Like residential plans, demand-based plans still charge for total energy consumption, measured in kilowatt-hours (kWh). The per-kWh charge may be fixed, may depend on the quantity used (i.e., more expensive as usage goes up) or it may depend on the season and time of day in a Time of Use plan.
(2) Demand: Power. In addition, utilities charge not just for energy consumed (in kWh) but also for the maximum rate of energy consumption in a short period of time (typically 15 or 30 minutes), at any time during the billing period (typically monthly). This is a measure of maximum power use rather than enregy consumption and so is priced on a per-kW basis. Demand charges can also depend on the season and time of day.
This post will discuss:
- Why the infrastructure costs and risks to grid stability from sharp fluctutations in power use by large customers justify demand-based pricing systems,
- How demand pricing creates different incentives for consumers than energy-consumption pricing alone, and how using electricity-consuming equipment in a staggered rather than parallel manner can meaningfully cut costs, and
- How different states structure their plans. In particular, different states have different ratios between energy consumption costs and demand costs, which leads to different strengths of economic incentives to smooth out energy usage over time.
What the Hell Is a Gigawatt?
26 March 2023
I sometimes find it frustrating as an observer of energy markets and policy to understand the quantities those markets deal in. News and commentators quote prices in different units depending on the underlying commodity or geographical market, making it difficult to intuit the importance of those prices. This post will serve as a gentle reference for what energy quantities mean and how to convert between different standard market conventions.
Here are some examples:
-
War in Ukraine. European wholesale natural gas prices (Dutch Title Transfer Facility or Dutch TTF) ran from €88 per megawatt hour (MWh) in February 2022 before Russia’s invasion of Ukraine, to a peak of €340 per MWh in August 2022 when concerns about a winter shortage crested. After conservation efforts, European countries securing liquefied natural gas imports, and a warmer-than-feared winter, prices fell back to €76 by January 2023 and to €40 by March. In 2020, these prices were under €20 per MWh.
-
U.S. Natural Gas Prices. Quoted in MMBTU (million british thermal units). Often are in the $2 to $4 range, but driven by Ukraine-driven supply shocks, briefly exceeded $9 in 2022. In California, a pipeline closure limited supply and prices averaged $19.40 per MMBTU in early January, and briefly exceeded $40 while the Henry Hub benchmark was under $4.00.
-
U.S. electricity generation. In February 2023, New England faced a cold snap that saw next-day wholesale electricity prices jump “by 140% to about $237 per megawatt hour.”. In 2019 the Millstone nuclear plant in Connecticut was kept in operation in part for a deal where the plant operator was guaranteed to sell half of its generation for $49.99 per MWh.
-
Global and U.S. Energy Consumption. BP’s Statistical Review of World Energy 2022 reported that global primary energy consumption was 595 exajoules (EJ) in 2021, 31 EJ above 2020 and 8 EJ higher than the pre-COVID 2019 levels. Meanwhile, the EIA reports total U.S. primary energy consumption of 98 quadrillion BTU.
-
Utility Bills. Electricity customers are generally billed in cents per kilowatt-hour (kWh). Utility natural gas is frequently billed in “Therms” or “CCF”. In Europe, natural gas is typically billed per kWh. In Australia, billing for gas is in megajoules (MJ).
-
Oil. And of course, crude oil is always quoted by market participants in dollars per barrel. And heating oil is sold in gallons when it is delivered by truck into New England homes.
Where this post is going, we don’t need roads…
Thoughts on Electricity Storage
28 February 2023
Energy storage – both home-scale and utility-scale – has become more relevant as the use of renewable energy for electricity generation proliferates. It is particularly topical recently, as the Inflation Reduction Act includes tax credits specifically targeting energy storage projects.
Energy storage (chemical batteries, pumped hydro storage, gravity-based batteries) transports electrical energy through time, from generation earlier to consumption later. Storage works when the aggregate amount of energy generated is adequate to satisfy aggregate demand, but there is a mismatch in the timing of supply and demand. Some basic fact patterns are:
- Demand More Variable than Supply. As discussed in previous posts, there is both a daily and a seasonal cycle to electricity usage. If a region’s generation is dominated by traditional base-load type power plants with high and constant generation capacity (nuclear, coal) or are quickly dispatchable (natural gas), there are two basic choices for meeting demand: either have enough generation capacity to cover the peak usage at any time, or marry sub-peak generation with the ability to store energy when demand is below supply and then release it for use when demand exceeds capacity.
- Supply More Variable through time than Demand. Supply can also be more variable than demand. Solar, for instance, generates electricity only during an 8-14 hour period during the daytime. The daily cycle of electricity usage varies but not this much: there is meaningful demand in the evening and through the night. So a grid with significant solar power will likely need to store daytime-generated energy to be deployed at night.
- Unplanned Intermittancy. A special case of supply variability: power outages due to storms or maintenance, or unfavorable weather conditions for solar / wind, can cause generation to temporarily fall short of demand.
This post will illustrate, using real-world electricity demand data and overly simplistic supply models (with no unplanned outages or weather intermittency) what profile of storage could be useful: how much energy capacity is needed and how frequently it is used. In all cases there will be a real-world question of whether it is more efficient to deploy capital in storage solutions or more generation capacity to compensate. A complete answer to that question is beyond the scope of this post, but my analysis provides some indication of feasibility of different architectures.
Here’s a summary:
-
In the constant generation model of traditional generation plants, it appears feasible to use battery storage to substitute for power generation that would cover the last ~10 - 20% of peak demand. Somewhat frustratingly, the strong variability of demand still means that this implies generation capacity that is adequate to supply more than 1.5 times the aggregate energy needs.
-
In a variable generation model like predominantly solar,1 there is some benefit in warm climates with mild winters from aligning higher summer generation with higher summer demand. But substantial storage is needed (probably more than is economical) to manage the day-night cycle. As with fixed generation however, there is so much variability of demand over time that the generation capacity measured in GWh needs to be a reasonable multiple of aggregate energy consumed.
- A combination, heavily weighted towards fixed, can get benefits of both fixed generation (no daily cycle) and solar (more generation with higher summer demand).
-
This post ignores wind power, which is too unpredictable for me to handle at this time. ↩
Daily, Seasonal and Weather-Driven Patterns in Utility Solar Generation
28 January 2023
This post explores a number of real-world considerations that need to be taken into account when incorporating utility-scale solar power into the mix of electricity generation. It will cover:
- The Difference Between Generating Capacity and Actual Output: Unlike some sources (e.g., nuclear, coal), which when active can consistently generate power very close to their maximum capacity, solar does not. I will use noisy generation data from a few U.S. regions to estimate both what utility-scale solar is physically capable of generating, and also how it falls short of that capability (predictably and unpredictably).
- The Daily Cycle: Solar produces electricity only during the day, and so in the real world it produces at most half of its maximum physical output. In fact, it is somewhat less than half, because there is minimal generation in the early morning or later afternoon when the sun is low in the sky.
- The Seasonal Cycle: Both because of shorter daylight hours and lower solar intensity, solar panels in winter generate meaningfully less juice than in summer. This post goes into details.
- Differences in Geography: While there is some variability across the U.S. in the seasonal / the daily cycle of how the sun moves across the sky, geography also brings climate differences. I will look at a few solar-heavy U.S. states to see just how big these differences are, and how much they detract from solar electricity generation.
I have two goals. The first is to show real data to quantify features of solar generation that are often qualitatively presented (e.g., intermittency). The second is to begin constructing a realistic model of solar as a variable electricity supply. This supply can then be matched up against the fluctuating demand levels for electricity that I have explored in previous posts. The intersection of supply and demand can generate other interesting outputs such as (1) how much energy storage is useful to have on the grid and/or (2) how much “overcapacity” of electricity generation needs to be built to fill gaps.
North vs. South: Seasonality in Electricity Consumption
14 December 2022
This post explores the seasonality of electricity usage, using both state-wide data and anecdotal individual homeowner data as examples.
- I start with a warm climate (Nevada, where I currently live), and notice a two-peak distribution throughout the year of electricity usage: a big peak in the summer (cooling) and a smaller, but distinctive, peak in the winter (likely heating).
- I then compare this to electricity usage in a cooler climate (Connecticut), which similarly has a two-peak pattern. Not surprisingly, the summer peak in Connecticut is smaller than Nevada; but the winter peak is not as prominent as I might have expected, likely because much of heating energy usage is not supplied by electricity but rather by fossil fuels directly (oil and gas). A good reminder that electricity consumption is not the same as total energy consumption.
- To see if this two-peak pattern was universal, I checked the extremes: Alaska and Florida. Indeed, these two states (almost uniquely) have only one peak: Alaska’s climate requires little to no cooling in the summer (so there is only a winter heating peak) and Florida requires little heating (so there is only a summer cooling peak).
- Finally, I look at the size of the summer and winter peaks throughout the country. Summer follows climate relatively intuitively: the hotter the summer, the bigger the summer electricity consumption peak. Winter is more complicated, and reflects both climate as well as the electricity / energy distinction, because homes in different parts of the country are heated by different means.
Anecdotes on Electricity Usage
7 November 2022
The previous post’s foray into electricity rates, especially Time-Of-Use (TOU) plans, inspired me to inquire about my own electricity usage patterns in the Las Vegas area. First, I will build some intuition about patterns of use by time of day by visualizing my smart-meter outputs (provided by NVEnergy’s website) on a handful of days across different seasons. I will then step back and look at total consumption across an entire year.
Introduction to Residential Electricity Rates
15 October 2022
This is the first of a sequence of posts exploring the structure of residential electricity rates in the U.S.
The project was inspired by a conversation I had with a friend who lives near San Diego, California. Owning an electric vehicle, he was keenly aware of the cost of using electricity (in cents per kWh) at different times of the day (he also sensibly only turned on the air conditioning in his house after 9pm).