North vs. South: Seasonality in Electricity Consumption
This post explores the seasonality of electricity usage, using both state-wide data and anecdotal individual homeowner data as examples.
- I start with a warm climate (Nevada, where I currently live), and notice a two-peak distribution throughout the year of electricity usage: a big peak in the summer (cooling) and a smaller, but distinctive, peak in the winter (likely heating).
- I then compare this to electricity usage in a cooler climate (Connecticut), which similarly has a two-peak pattern. Not surprisingly, the summer peak in Connecticut is smaller than Nevada; but the winter peak is not as prominent as I might have expected, likely because much of heating energy usage is not supplied by electricity but rather by fossil fuels directly (oil and gas). A good reminder that electricity consumption is not the same as total energy consumption.
- To see if this two-peak pattern was universal, I checked the extremes: Alaska and Florida. Indeed, these two states (almost uniquely) have only one peak: Alaska’s climate requires little to no cooling in the summer (so there is only a winter heating peak) and Florida requires little heating (so there is only a summer cooling peak).
- Finally, I look at the size of the summer and winter peaks throughout the country. Summer follows climate relatively intuitively: the hotter the summer, the bigger the summer electricity consumption peak. Winter is more complicated, and reflects both climate as well as the electricity / energy distinction, because homes in different parts of the country are heated by different means.
Nevada: Double Peak, Emphasis on Summer Cooling
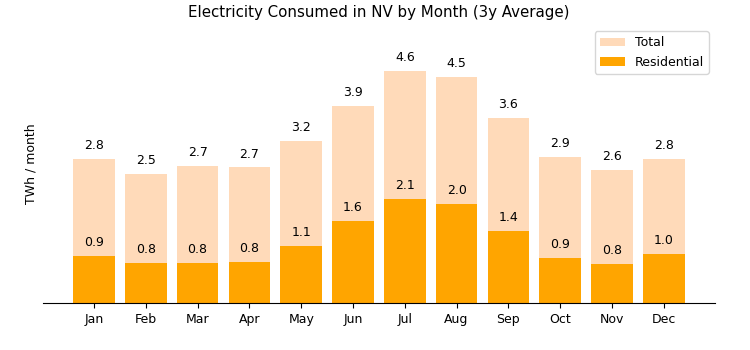
The following chart shows Nevada’s monthly consumption throughout the year in TeraWatt-hours (1 billion kWh), averaged over the 3 year period Sep. 2019 to Aug. 2022. My source is the U.S. Energy Information Agency, which provides excellent data sets breaking down energy consumption by state, month and sector.
Several observations:
- Average electrcity consumption of 4,500 kWh per year (14.1 TWh / 3.1mm residents), which at a current fixed rate of 12.5 cents / kWh, equates to an average annual cost per person of $562.50
- Intuitively, there is heavy seasonality of electricity usage in Nevada
- Minimum consumption in the late fall / early spring, when outdoor
- Also intuitively, there is a very prominent “air conditioning” peak in the summer
- 49.8% of the state’s total electricity consumption occurs in 1/3 of the year (June, July, August, September)
- Peak usage month (July) is 2.63x the minimum month (November)
- A bit surprising was that there is a clear winter peak, with December usage at 1.24x the minimum
- Heating may play some role – although many residences use gas furnaces for heating, some portion are heated by electricity
- In addition, there may be more lighting / appliance usage with shorter daylight hours
Note that the total state electricity consumption has less seasonal variation than the residential sector alone. Highly variable climate control is presumably a lower proportion of commercial and industrial electricity usage than for residences.
With this data, I was able to confirm that the seasonal patterns of my own electricity use are very typical of Nevada residents.
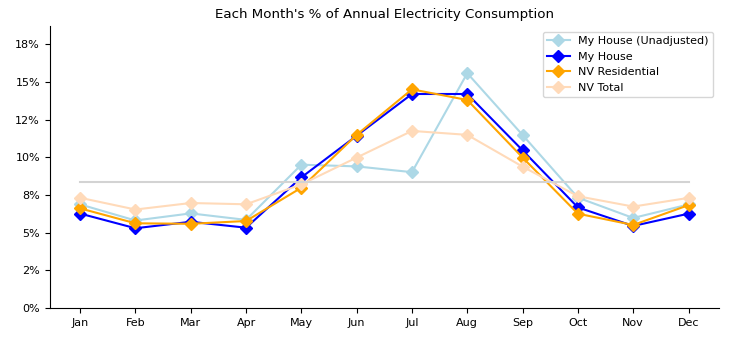
The graph below show the fraction of annual consumption in each calendar quarter (both individual, and state-wide).1
Northern Lands: Both Cooling and Heating Peak
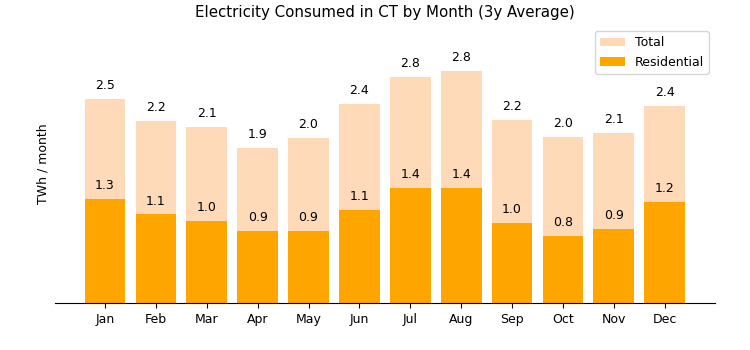
Next up, a colder climate: Connecticut in the U.S. Northeast. Average January / July high temperatures in New Haven, CT: 37°F / 86°F (Las Vegas: 59°F / 107°F). Below is the statewide monthly consumption chart for the state.
Observations:
- Annual electricity consumption per capita is ~3,600 kWh (13.0 TWh / 3.6mm people), $864 average per person at the 2H 2022 cost of $0.24 / kWh.
- The lower overall consumption in electric energy than Nevada may reflect that winter heating is a more important part of the energy picture in the Northeast than in hot Las Vegas, and heating energy is often supplied by fossil fuels (natural gas / oil) as opposed to electricity.
- Minimum consumption once again is in spring / fall
- There is an air-conditioning summer peak, but it is much smaller than in Nevada
- 37% of annual residentual consumption is in the 4 summer months June through September
- Peak usage month (August) is only 1.49x the minimum (April)
- There is a second peak in the winter, corresponding to heating season
- The peak is larger than Nevada’s winter peak (it’s colder), but still smaller than summer: Connecticut January usage is 1.31x April’s minimum.
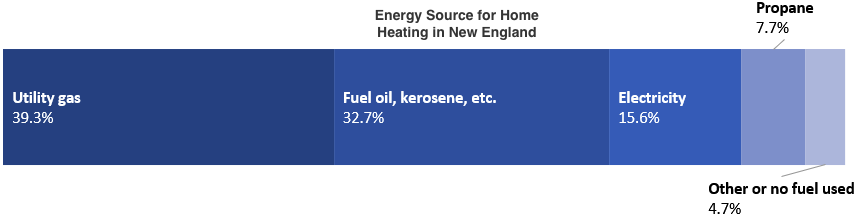
- Like the overall lower electricity consumption, this is likely driven by the fact that the winter part of New England heating and cooling is mostly powered by fossil fuels (80% between heating oil, natural gas and propane) rather than electricity.
- That there remains some winter peak derives from the fraction of home heating (16% in New England) that is electric powered.2
The impact of heating energy source is illustrated by comparing the seasonal profile of two houses in Connecticut: (1) one with an all-electric HVAC system (heat pump for both heating and cooling), and (2) another with heat provided by utility natural-gas furnaces.
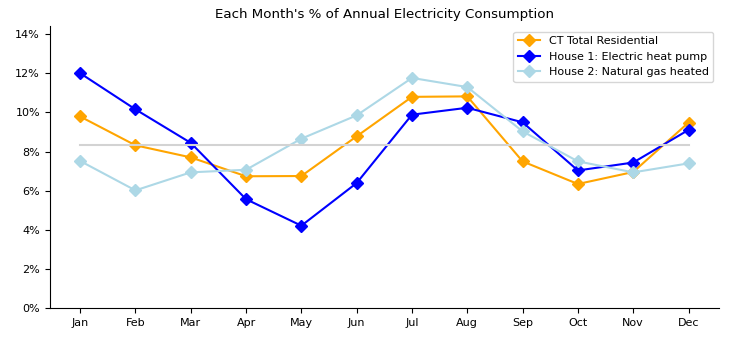
Notice that for the house with gas-fueled winter heat, the winter electricity peak is small (1.25x the minimum month) while the summer peak is quite prominent (close to 2.0x). Meanwhile, the winter peak for the all-electric HVAC house is larger (2.3x minimum) than the summer A/C peak (1.9x the minimum): it takes more energy to heat a home 30-50 degrees above the outside temperature than it does to cool a home 10-20 degrees cooler than the outside temperature. The state-wide portfolio, which is a blend of these two categories (but weighted towards fossil fuels), thus has a blended seasonality profile as seen above.
Exceptions in the Extreme: Alaska and Florida
Most U.S. states consume electricity with seasonality akin to Nevada and Connecticut: winter (partial) heating peak, summer air conditioning peak, and spring/fall troughs where there is little HVAC needed one way or the other. This is not true for Alaska and Florida:
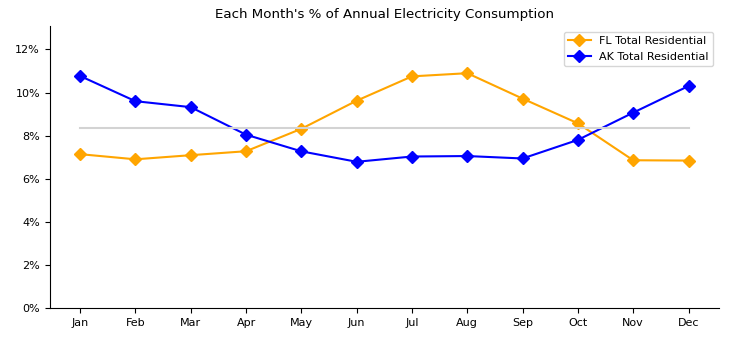
Much of Alaska is always colder than indoor comfortable temperatures: summer high temperatures in Anchorage are just above 60°F. So the annual cycle ranges from “heavy electricity consumption for heating in winter” to “moderate electricity consumption for heating in summer”, with no summer peak at all. The winter peak is 1.6x the summer trough.
Florida is the opposite: it is always hot and humid, and many residents use air conditioning all year round (with occasional winter heating), with more of it being used in the summer. So the annual cycle is various degrees of electricity for cooling, peaking in summer. Summer consumption is 1.6x the winter minimum.
A Full-U.S. Look at Seasonality
Beyond the individual examples above, the maps below show the height of the summer and winter electricity usage peak month, as a multiple of the consumption in the lowest electricity month, typically a fall or spring month. Higher numbers (e.g., 2 - 2.5x) evidence greater seasonal variation in electricity usage than lower numbers (e.g., 1.25 - 1.5x). The full data set that drives the maps is here.
While there are other measures of seasonality (e.g., % of total consumption in the summer months), I find the peak-height metric interesting because it conveys the full range of power output that the grid must supply. Electricity generation plants must provide not merely the total energy consumed in a locale throughout the year, but must instantaneously provide the power demanded at all times – up to a peak consumption much higher than the average. Coping with this variability is the challenge and miracle of the grid, and different generation sources contribute differentially into this variability of demand. Nuclear, hydroelectric and coal, for example, are useful as “always on” base load generation, while natural gas is often used in “peaker” plants that can by cycled up and down to deal with fluctuations.
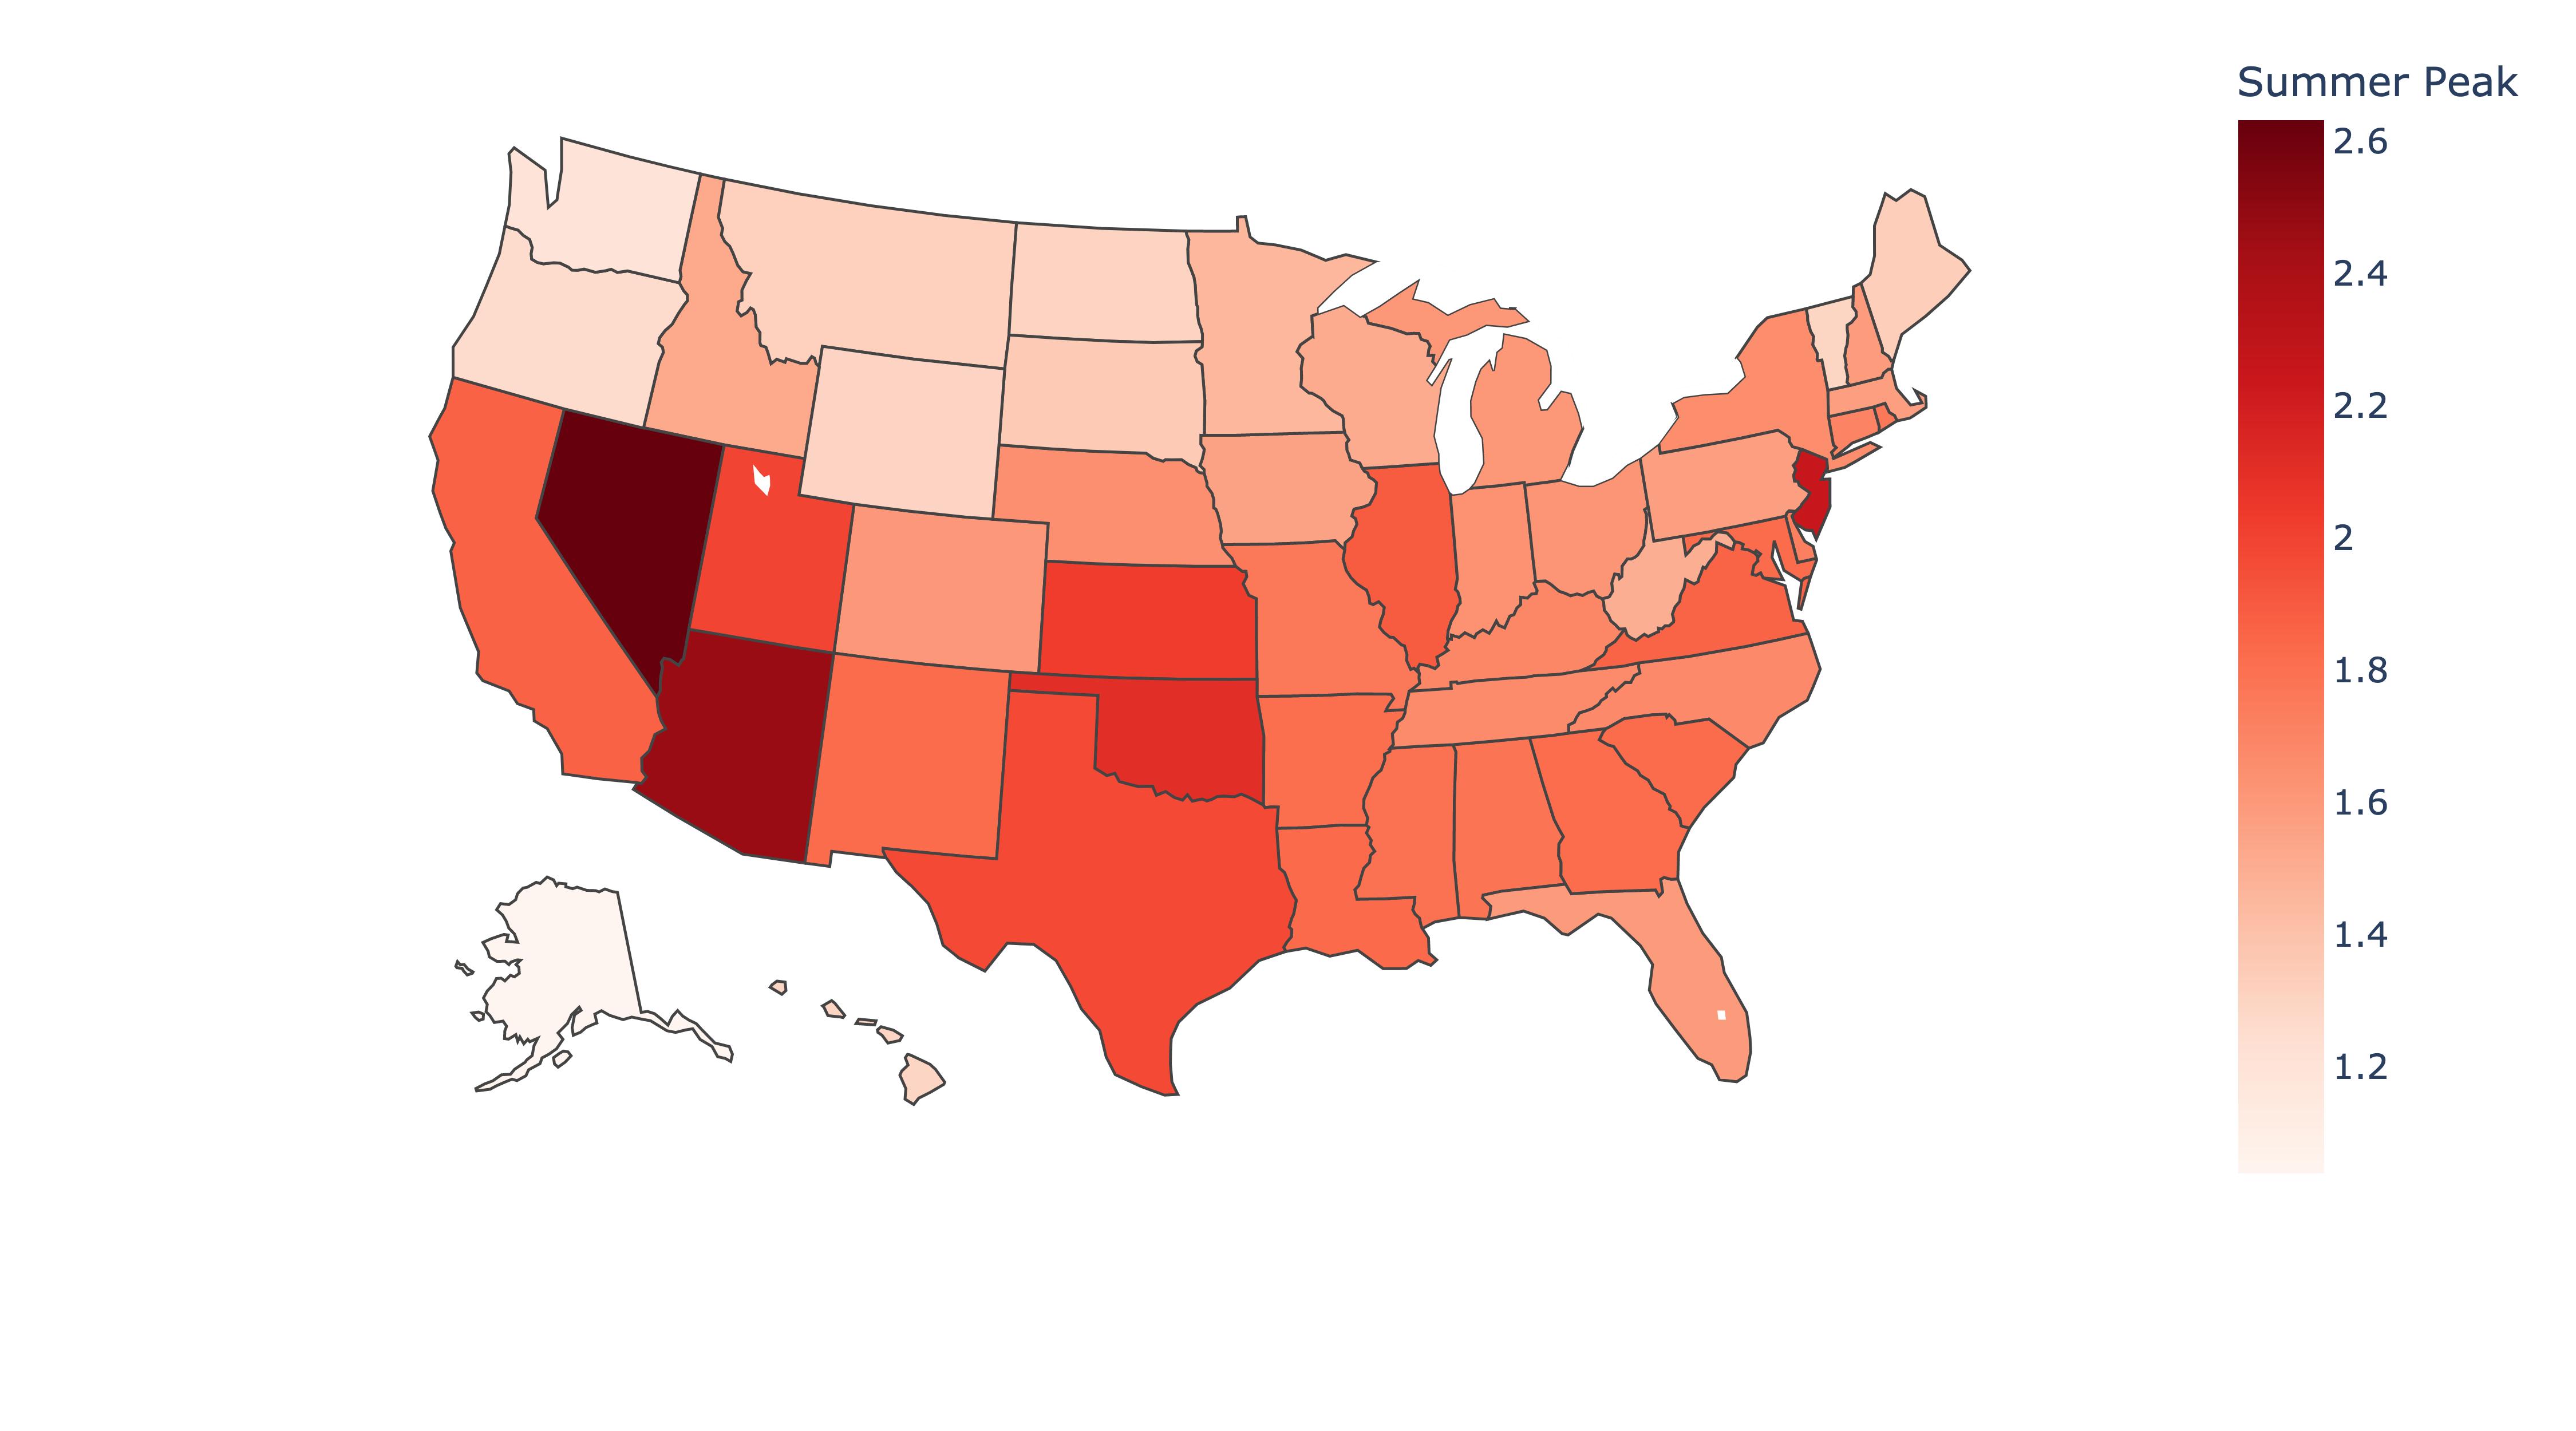
Starting with the summer analysis, we see the general pattern that southern states with hotter summers and presumably more air-conditioning usage have a higher relative electricity consumption than northern states with cooler summers. The states with the highest summer peak values (Nevada at 2.63x and Arizona at 2.47x) have the two cities – Las Vegas and Phoenix – with the highest number of days that reach 100°F (Austin, TX is a distant third).
Some of the states that buck this intuition are souther locations where the weather is warm but consistently so (i.e., summer isn’t too much warmer). Florida (discussed above) is an example of this, as is Hawaii. Curiously, New Jersey has the third-highest relative summer peak, at 2.25x.
The winter map below is more complicated than the simple inverse of summer. Generally, there are higher winter peaks in northern states with colder climates as more energy is used for winter heating. However, climate is not only the explanatory variable.
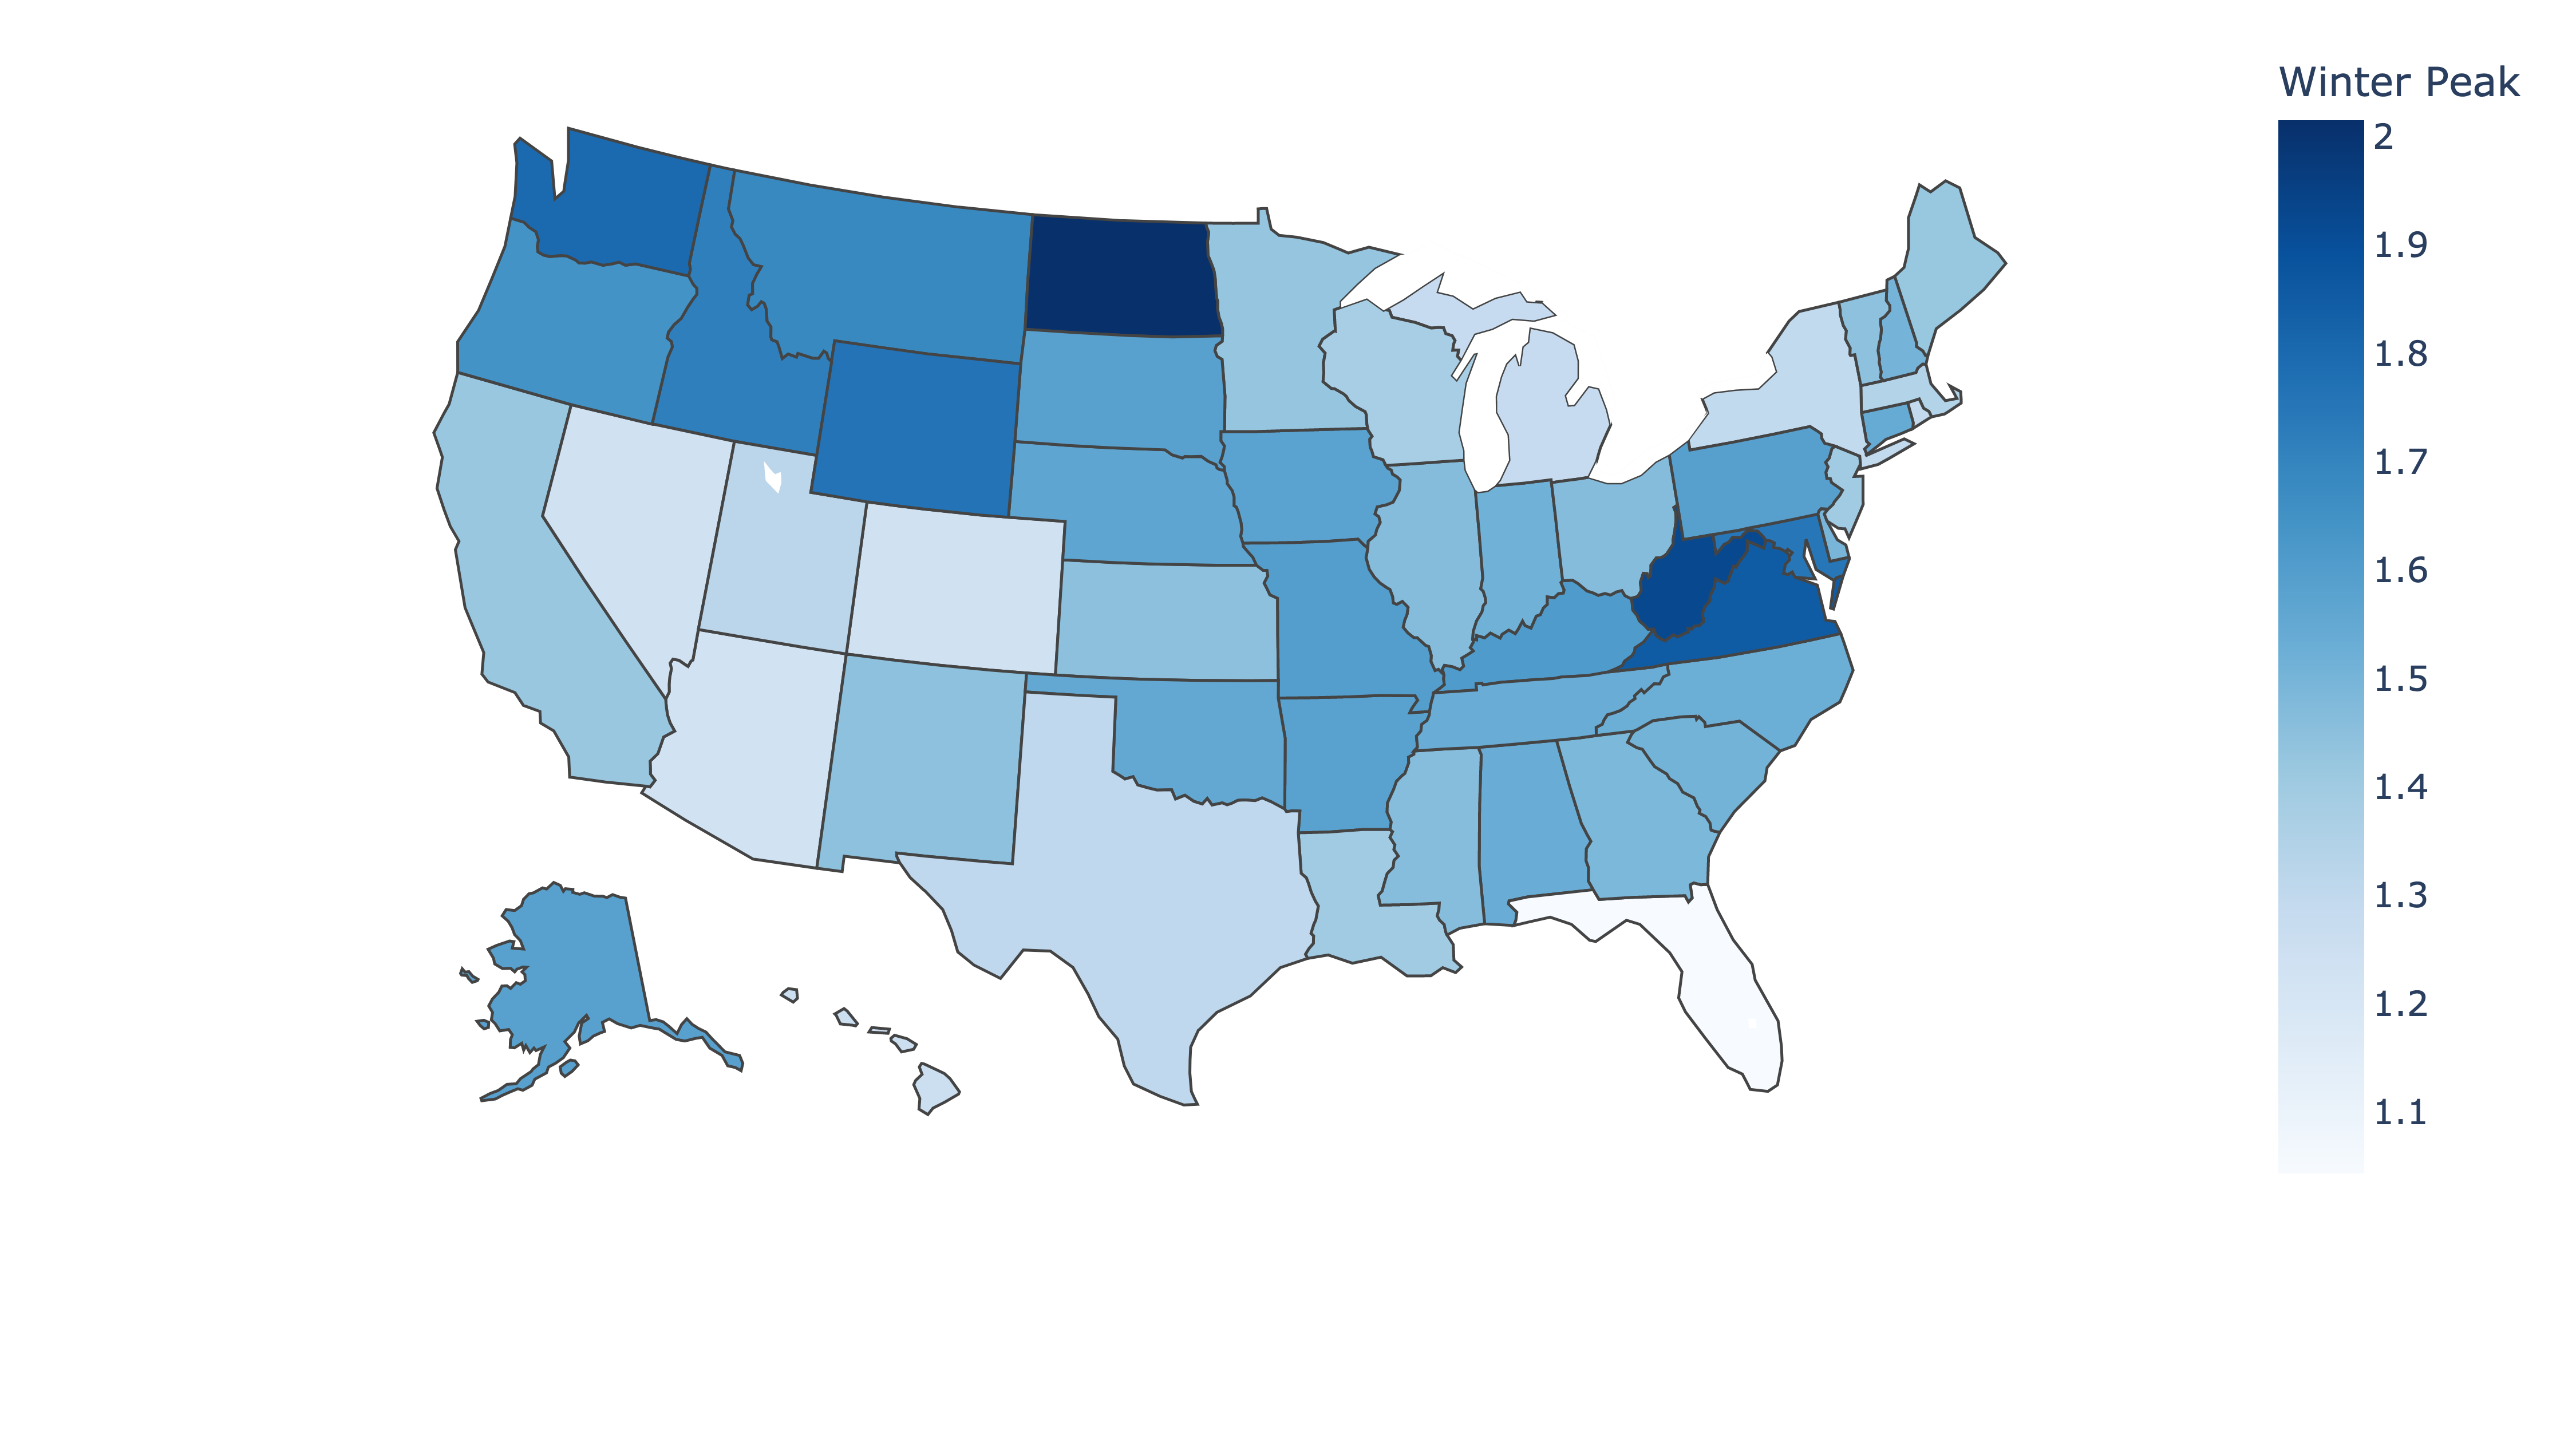
As discussed above, winter heating fuel source also drives variation. North Dakota, for example, has a similar climate to surrounding states Montana, Minnesota and South Dakota. However, 41% of its homes use electric heat in the winter, compared to 27%, 19% and 33% for the other three, likely explaining its stand-out dark blue color (2.0x vs the others between 1.4 and 1.7x). The same is true of West Virginia and Virginia, which also have a higher-than avearge fraction of homes with electric heating (45% and 57%), while Michigan and New York, despite cold winters, have low shares of electric heating (12% and 15%). Their use of non-electricity energy sources in winter thus makes them appear in ligher blue shades than their neighbors.
This is not the full story: even beyond primary sources of heating, Doomberg and Meredith Angwin detail how much of an impact even supplemental heating via space heaters has in extremely cold conditions, which can destabilize the New England grid despite a relatively low proportion of electric heated homes and a modest average peak in winter electricity usage.
A Complicated Reality (and Electricity vs. Energy)
This blog started with a simple comparison of my electricity usage throughout the year, and revealed a complicated reality. Seasonal variation in electricity demand is determined in part by climate. But because electricity is only a part of total energy consumption, electricity demand patterns are determined also by local infrastructure decisions about how humans heat and cool their homes. This in turn depends on other variables like whether residential areas are dense enough to merit utility natural gas, or whether heating oil is efficiently deliverable by truck. Regulations and grid architecture surely play a role as well, and this is before even getting into the different characteristics of different flavors of electricity generation.
Code and Coda
The coding for this post was fun, and I focused particularly on modularizing the reading of utility-provided CSV files with home usage of various cadence (all the way from 15-minute granularity to monthly usage data). The mapping visualization was provided by plotly.
I welcome a discussion with any readers who care to share data and draw lessons from it, especially commercial / industrial customers with energy as a significant input to operations, and who face a more complicated set of decisions (including demand-spike based pricing).
And if anyone can explain New Jersey, please reach out to me.
-
In the dark blue series, the artificially-low consumption in June-July due to travel has been replaced by (1) July being assumed to be the same as August and (2) June being halfway between May and August. ↩
-
The graphic above, and New England stats for 2021, are courtesy the Massachusetts state website (downloaded 26-Nov-22). ↩