Impact of a New Nuclear Plant on Carbon Emissions
It has been common in recent years to see commentary nuclear power plant closure results in increased electricity generation by fossil-fuel buring power plants. Examples include the 2021 shut-down of Indian Point in New York State, and the 2023 closure of Germany’s three last operating nuclear plants which left the country’s generation footprint as being among the most carbon-intensive in Europe.
This article explores the impact on fossil-fuel burning electricity generation around a similar natural experiment in the other direction: the activation of the Vogtle 3 nuclear power plant in the U.S. state of Georgia on July 31, 2023.
I draw on data from the U.S. region where the grid is operated by The Southern Company (most of Alabama and Georgia and smaller parts of Misssissippi and Florida). Beginning with the noisy picture of how much power is generated daily by each nuclear plant in the region, I build to the smoother picture of how much electricity is generated by the region’s plants (both before and after Vogtle 3 came online).
I then examine the overall electricity generation profile of the region in comparable months over several years (attempting to control for different demand profiles in different seasons), and estimate the carbon impact of the new Vogtle plant.
A Picture of One Region’s Nuclear Supply
There are seven nuclear plants in The Southern Company’s territory: two at Farley Nuclear Generating Plant in Alabama (recently upgraded to ~950 MW each), two at the Hatch plant in Georgia (924 MW each) and now three at Vogtle in Georgia (~1,150 MW each)
The Nuclear Regulatory Commission provides daily reports of the power output of each nuclear plant in the U.S. (as a percentage of that plant’s maximum capacity). Taking the percent power generation for each plant and applying it to the capacity, we can see a picture of the region’s day-by-day nuclear capacity in the plot below.
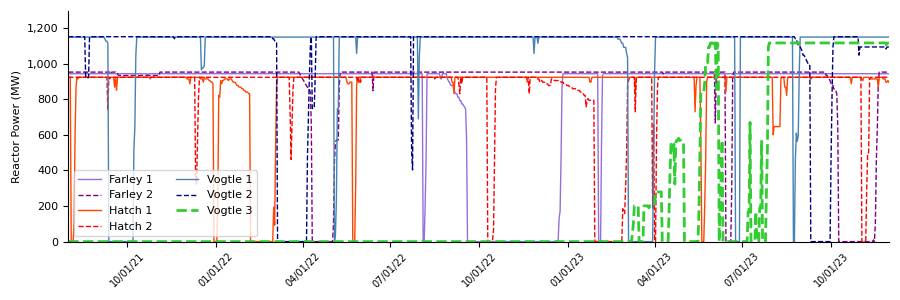
Notable features:
- Most visible is the ramp-up at Vogtle Unit 3 as it was tested and brought up to full power for service July 31, 2023
- Every 1.5 to 2 years, plants undergo a several-week to several-month long refueling outage preceded by a “rampdown” in output (e.g., Vogtle 1 in Sep. 2021 and March 2023; Vogtle 2 in March 2022 and Sep. 2023; Farley 2 in April 2022 and Oct. 2023)
- Unscheduled outages due to equipment failures or minor upgrades lasting a few days also occur
Summing the generation together for all plants produces a smoother picture.
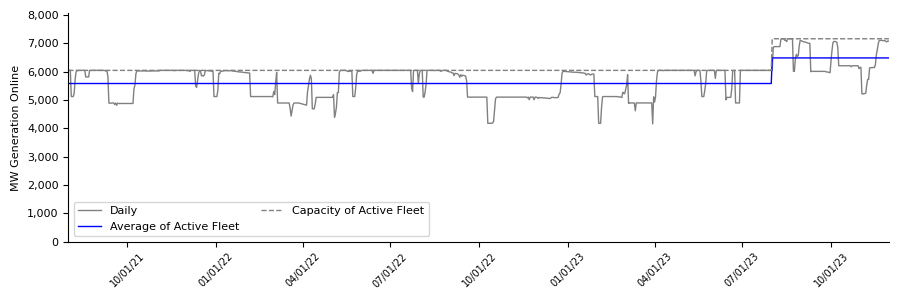
While there are discrete ups and downs, we see an overall generation trend at ~90% of capacity. The fleet has not had many days at full capacity since Vogtle 3 came online – in part because it has been autumn and spring and autumn are when plants typically plan refueling outages. But the contribution of the additional 1.1 GW of generation creates a material step-up in nuclear generation: 900 MW based on these months alone, and assuming the capacity factor pre-and-post Vogtle stabilizes at equivalent levels of ~92%, the run-rate contribution of the plant will be just above 1 GW.
| 2 Years Pre-Vogtle | Since Vogtle | |
|---|---|---|
| Aug 2021 to Jul 2023 | Aug 2023 to Nov 2023 | |
| Capacity (MW) | 6,047 | 7,164 |
| Average Generation (MW) | 5,583 | 6,487 |
| % | 92.3% | 90.6% |
Impact to Carbon Emitting Generation Over Time
Simple Statistics are Confounded
With the incremental carbon-fee generation, we’d expect the Southeast region to see a step-function down in generation from carbon-generating sources (coal and natural gas) for comparable periods in 2021-2022 vs. 2023. The below chart shows the generation from the main sources in the system for each of August, September, October and November (the 4 months since Vogtle 3 came online) for the last 3 years.
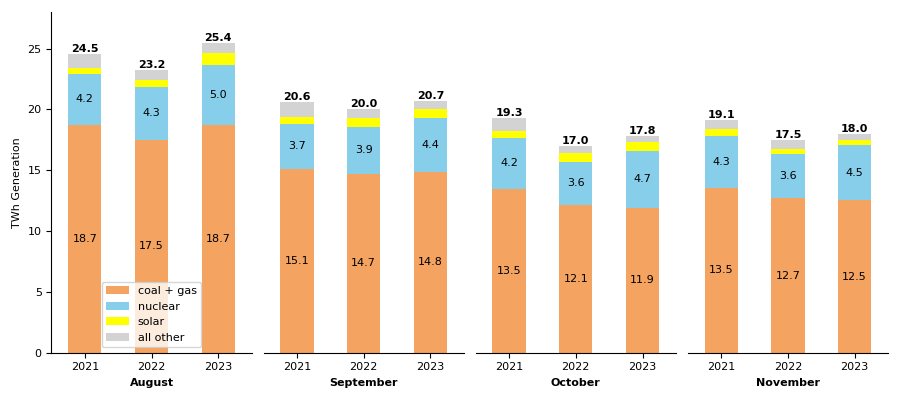
The simple analysis is surprisingly inconclusive. There is no obvious decrease in gas + coal generation in 2023 (the monthly averages across the 3 years are in fact 15.2 TWh, 14.3 TWh, and 14.5 TWh), although there is enough evidence of confounding factors that a closer look is needed:
- August 2023 saw 18.7 TWh of gas + coal generation, the same as 2021 and higher than the 2022 level. But August 2023 was the hottest month in a very hot summer, and total demand and generation was higher than in previous years, so 18.7 TWh may have been less than what we would have seen without Vogtle 3.
- October and November 2023 saw 0.2 TWh decrease from 2022’s gas + coal levels despite a higher overall demand and generation total.
- October and November 2023 saw meaningful decreases from 2021’s levels, but the impact of Vogtle’s presence vs. the overall lower generation total is not immediately apparent
More Detailed Analysis
The idea of a possible depedence on total generation makes sense: natural gas espcially serves a “peaking” role in our grid, bridging the gap between total demand and sources of elecricity that are supply constrained such as: (1) nuclear, which has very high fixed costs and low marginal costs and is not easy to vary in response to demand and (2) weather-based sources where generation capacity is determined by extrinsic inputs such as weather (solar, wind, hydro).
Since supply-constrained generation should be largely independent of demand level, we’d expect fossil-fuel generation to have a high correlation to total electricity demand. The monthly chart above hints at this relationship, but to establish it more firmly we need more data points.
The below chart reports the relationship between daily total generation and daily fossil-fuel generation during August - November in each of the years 2021, 2022 and 2023 (all daily totals in GWh were divided by 24 hours to show the average generation rate in GW for the day).
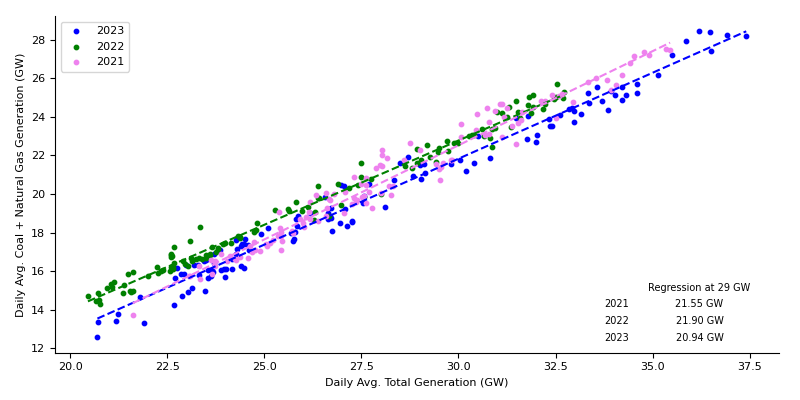
Once we use regression analysis to control for the daily fluctiation in total electricity demanded and generated, we can see that 2023 has a lower fossil-generation level for each given level of total demand than 2021 or 2022. For a typical level of total demand (29 GW, the middle of the chart), in 2023 there was about 600 MW less natural gas and coal generation than 2021 and 1 GW less than 2022.
Impact to Carbon Footprint
The Energy Information Agency provides data on the carbon-dioxide intensity of electricity generation from different fuel sources. In 2022, Coal and Natural Gas had the following profiles:
| Fuel type | 2022 U.S. Generation (TWh) | 2022 CO2 Emissions (million metric tons) | Million Metric tons per TWh |
|---|---|---|---|
| Coal | 831.5 | 868 | 1.04 |
| Natural Gas | 1,687.1 | 743 | 0.44 |
| All energy sources | 4,230.7 | 1,650 | 0.39 |
Source: EIA
During the years 2021 - 2023, the southeast region generated 360 TWh of electricity from natural gas and 130 TWh from coal, so from simple proportions we can say that each TWh of fossil-fuel generation is 0.73 TWh reduction in natural gas generation and 0.27 TWh reduciton in coal generation. Converting into CO2 emissions:
\[0.73 \times 0.44 \frac{MM~tons}{TWh} (gas) + 0.27 \times 1.04 \frac{MM~tons}{TWh} (coal) = 0.60 \frac{MM~tons~CO_2}{TWh} (blended)\]If the presence of the new nuclear plant gives us 600 - 1,000 MW less natural gas / coal generation, we get the following reduciton in CO2 emissions over the course of a year (8,760 hours):
| Fossil generation reduction | 600 MW | 1,000 MW |
|---|---|---|
| Annual reduction (TWh) | 5.26 | 8.76 |
| CO2 equivalent (MM tons) | 3.15 | 5.26 |
So we get an annualized reduction of 3.15 to 5.26 million metric tons of CO2 emmission. By comparison, an average car emits 4.6 metric tons of CO2 per year, making the impact of Vogtle 3 the equivalent of removing the emissions of about 685,000 to 1.14 million automobiles from the road.
Conclusion
It may seem obvious that a nuclear plant coming on line should displace fossil-fuel burning sources of electricity on the grid, and result in a reduction in CO2 emissions. Because electricity generation is highly variable over time, actually observing this relationship is not as easy at taking simple averages, but the relationship is indeed borne out by basic regression analysis. Vogtle Unit 4 is scheduled to begin operations in the first quarter of 2024, another look at the data then should hopefully make this impact even more clear.