AI and Data Centers Driving Electricity Growth: A Look at Virginia
Electricity demand in the U.S. has had near-zero growth for the last several decades. According to a Goldman Sachs report, “US annual power generation over the past 20 years averag[ed] less than 0.5% growth.” In recent months, utility reports and media coverage have proclaimed a shift towards resumed electricity growth. This is attributed primarily to growth in data center installations, which has been accelerated by data-intensive AI applications, along with other electrification initatives including electric vehicles and electric heating. The Goldman Sachs report, for instance, forecasts 2.4% annual growth through 2030.
This post collects utility scale data that this acceleration is not only in the future, but has already started to occur. Virginia, home to half the data center market in the U.S., has already seen electricity demand average year-over-year growth rates close to 4% since 2019, compared to near zero for neighboring regions. This demand growth in Virginia approximately tracks the increase in data centers there.
Virginia’s Electricity Demand
Growth Data
Using Energy Information Administration data, we plot the average electricity demanded for each month since 2019 in the Dominion Energy Virginia sub-region, which accounts for the majority of Virginia’s territory including Northern Virginia suburbs in Loudon County with the bulk of data center installations.
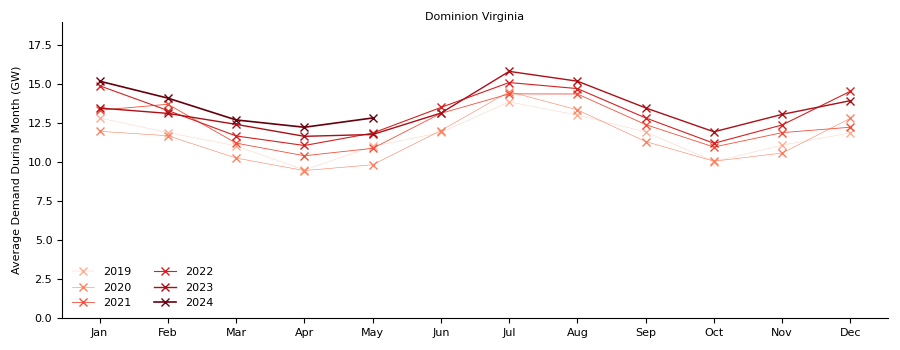
A few things stand out:
- The typical seasonal pattern of peaks in summer (for cooling) and winter (for heating)
- A COVID-driven dip in demand from 2019 to 2020, followed by a rebound in 2021
- Most relevantly, a consistent growth trend from year to year, anecdotally supporting the data center story.
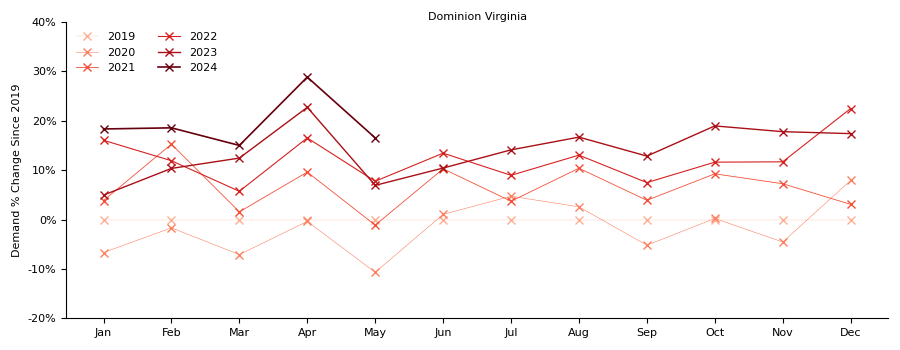
How much growth? The following chart shows the cumulative percentage growth for each month since the corresponding month in 2019, which we consider our baseline year. We use the corresponding month to try to eliminate the effect of seasonality (e.g., December 2022 appears to have been particularly cold). On average, in this limited data set of 53 months, the average year-over-year increase was 3.9% (+/- a large 6.5% standard deviation due to significant swings like hot or cold weather one year to another, COVID and recovery from COVID, etc).
Other Regions’ Growth
The 3.9% average year-over-year growth in Virginia can be contrasted to the same data for four adjacent regions in the southeastern and mid-Atlantic United States: (1) Tennessee, (2) the Carolinas region, (3) the Baltimore region, and (4) the “American Electric Power” subregion of PJM, covering parts of western Virginia (not where the data centers are), West Virginia and southern Ohio.
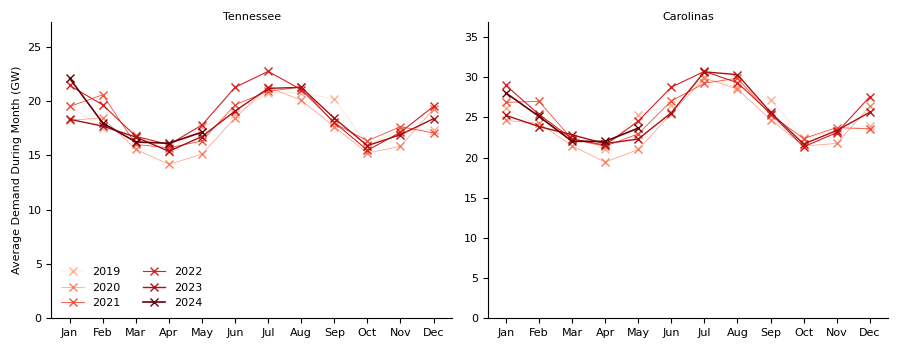
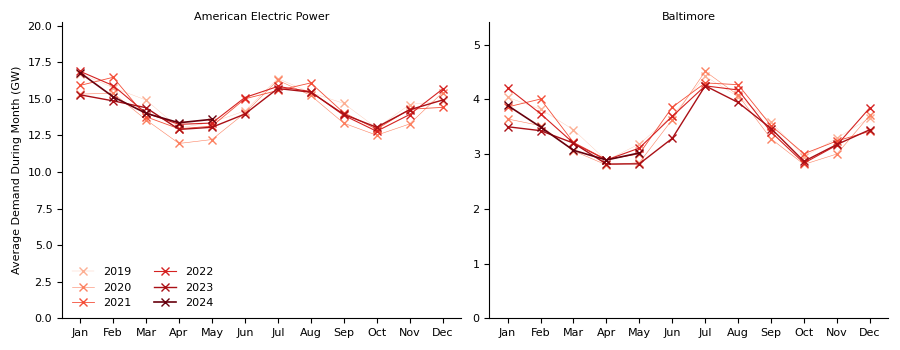
None of these charts show the same upward trend seen in the Virginia data above. They all tell the same near-zero growth trajectory story attributed to the U.S. more broadly.
| Dominion Virginia | Carolinas | Tennessee | Am. Electric Power | Baltimore Area | |
|---|---|---|---|---|---|
| Average YoY Growth % | 3.9% | 0.4% | 0.5% | -0.2% | -1.0% |
| Std dev | 6.5% | 7.0% | 7.8% | 5.3% | 6.8% |
Comparison to Data Center Growth
So the part of Virginia including Data Center Alley has shown ~3.5 - 4.0% excess growth per annum compared to nearby regions. Can we tell whether that is in fact data center-driven?
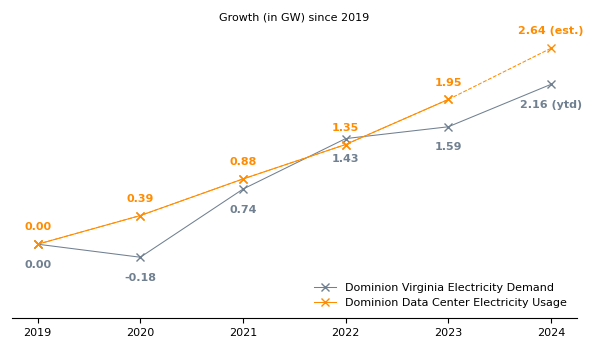
The below chart plots data from PJM (source: GS report) showing the increase since 2019 in data-center electricity consumption in GW in the Dominion Virginia region, against the overall increase in average electricity consumption in the region since 2019. While not perfectly aligned, they move strongly together.
Conclusion
Electricity demand data fits the story: Virginia, the center of gravity for data center growth, does indeed show a strong increase in electricity consumption over the last 5 years relative to neighboring regions. The level of increase, moreover, reasonably tracks the reported growth in data center electricity usage. As this sector continues to grow, we should expect continued demand growth in Virginia and other geographies that begin to attract these installations.