Anecdotes on Electricity Usage
The previous post’s foray into electricity rates, especially Time-Of-Use (TOU) plans, inspired me to inquire about my own electricity usage patterns in the Las Vegas area. First, I will build some intuition about patterns of use by time of day by visualizing my smart-meter outputs (provided by NVEnergy’s website) on a handful of days across different seasons. I will then step back and look at total consumption across an entire year. This post is also intended to help drive a bit of intuition about the numbers of electricity consumption for a home.
A Sampling of Few Days’ Data
Winter
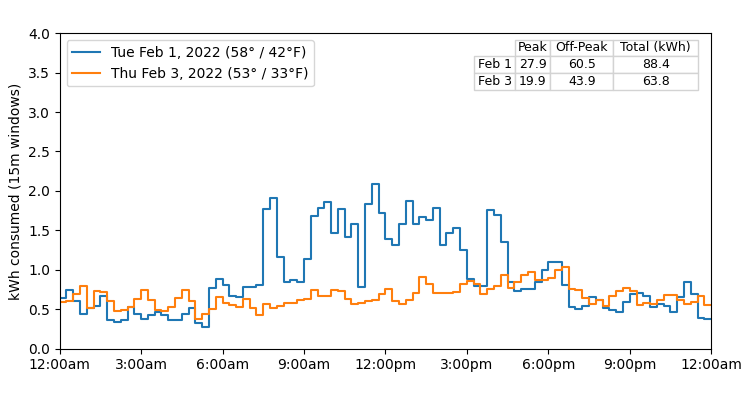
Winter electricity usage is modest – temperatures are chilly but our heating is natural-gas powered (this uses a little bit of electricity, generating the day-long squiggles, but not too much). Thus the 64 kWh consumption from 3-Feb is about our baseline usage from lights and appliances. The 25 kWh increase on Tuesday 1-Feb is the impact of our once-a-week laundry day: our electric dryer is rated 26A x 240V = ~6 kW maximum, so running it for 5-6 hours with some breaks and some low power times (e.g., cool down) seems to approximately account for the 25 kWh.
Summer
August in Nevada is hot, both in high temperatures (many days over 100°F) and low temperatures (many over 80°F), meaning air conditioning tends to run most of the day and night. This brings the total electricity usage to 2.0 to 2.5x the winter baseline usage.
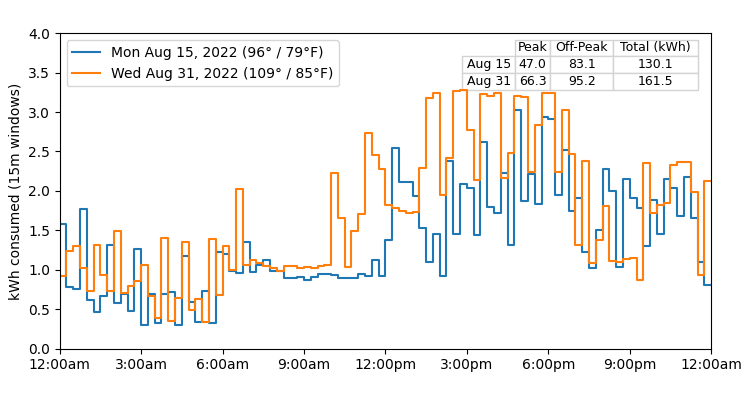
Consumption is very sensitive to temperature: 164 kWh on the 109° day vs. 131 on the 96° day, with the majority of the increase coming from peak hours. Our family keeps the house 4° cooler at night, so the general pattern is moderate usage at night when it is not as hot, to maintain the cooler temperatures; lower usage in the late morning as we let the house warm up a bit during the day; and much higher usage in the late afternoon / evening at the hottest time of the day.
Spring
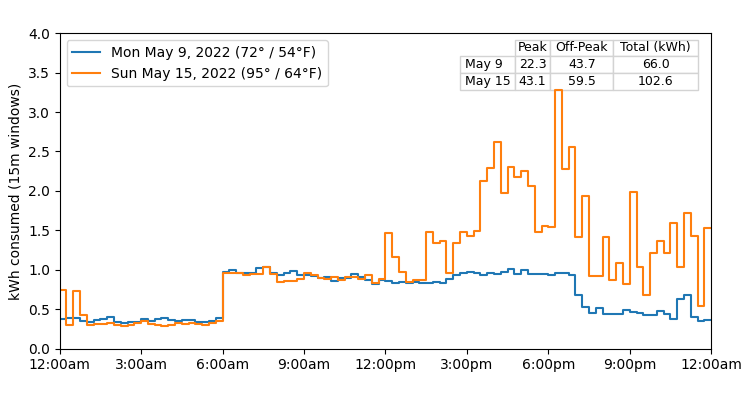
May is temperate, although there can be some days above 90° F. Notice the signficant difference between a warm day (72° F) – where total electricity usage is similar to winter at 66 kWh and a hot day where the air conditioning needed to kick on in the late afternoon, bringing total usage to 103 kWh. This is not as much as hot summer days – the low temperatures in May are still cool, so once the house is cooled down in the evening the air conditioning does not need to run all night, or even in the early part of the daytime.
Finally, note the ~0.5 kWh per 15 minutes jump at 6am. This corresponds to the pool filter turning on in the morning (validated by some quick internet research that the power usage of pool filters is around 2 kW). This jump is there in August, but it is buried under A/C variability.
Does the Peak / Off-Peak Split Make Sense?
Recall that in Nevada’s Time of Use plan, Peak rates are charged June through September, between 1pm and 7pm.
The graph below looks at all days in each month from August 2021 to September 2022, and shows the average amount of electricity (kWh) consumed at my house during each of the 24 hours of the day. Horizontal lines are full-year average across all hours of all days (3.3 kWh) and 150% of the average (5.0 kWh), to give a sense of how big spikes are.
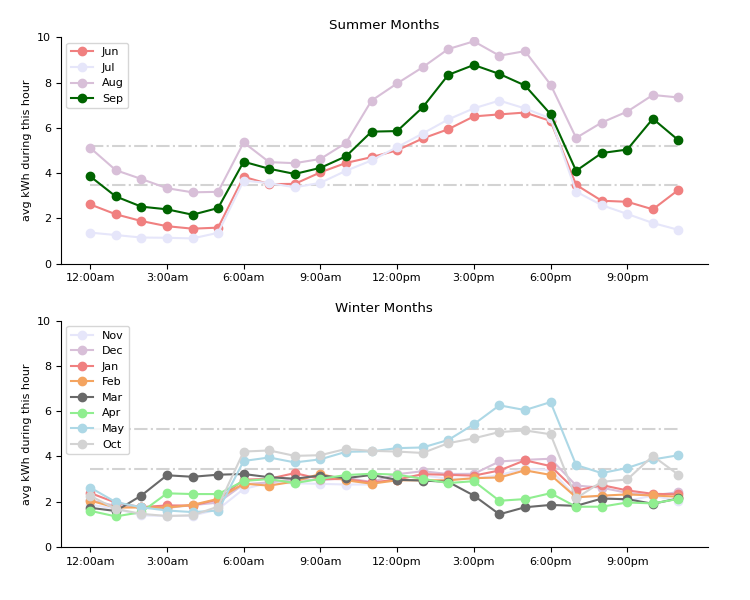
The first observation is the hours of summer peak usage. Highest electricity consumption does fall in the 1pm to 7pm period, consistent with peak hours. However, at least during the very hottest months, usage is still significantly elevated use (> 1.5x average) as early as 11am and in the 7pm-9pm window as well (the drop in my chart at 7pm is is the 2 kW of pool filter turning off), potentially justifying a larger number of peak hours. My consumption may be idiosyncratic, so whether this pattern exists state-wide would determine whether my observtions scale.
Second, there are basically two seasons of residential electricity usage in Nevada: non-summer (October through April) when there is little to no air conditioning use and consumption is roughly flat. Second, June through September represent a distinctly higher level of use, again consistent with the setup of the TOU plan. May is an intermediate case, somewhat similar to September, so one could imagine a TOU plan that makes May a peak month as well (but the levels may not be high enough to strain on generation capacity in the state). Note that the June / July bars in 2022 are closer to May (lower than one would expect) for my family despite hot temperatures: this is a side effect of traveling for a number of weeks during this month and setting the house to 85°F rather than 76-80°F.
The annual pattern contrasts to colder regions like New England, where electric heating results in a winter peak usage season described by Doomberg here. I experienced this myself in Connecticut where our HVAC was entirely electric compressor driven, resulting in both summer A/C and winter heat peaks.
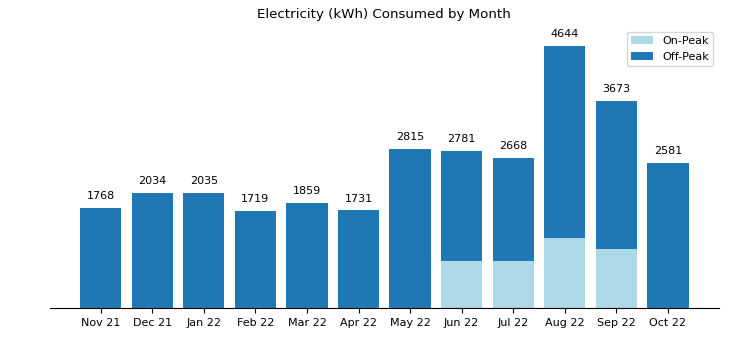
The full monthly totals below give a consistent picture.
As an aside, at an average electricity consumption of 3.3 kWh per hour (i.e., 3.3 kW average power demand), a large 1 GW power plant (like the units at the Vogtle nuclear power plant in Georgia) would supply about 300,000 houses. But this analysis is clearly inadequate given our peak summertime demands of ~10kW, which points at the challenge of supplying both base and peak generation capacity.
Applying the Cost of Plans
Last, I apply the cost per kWh under both the fixed rate plan (which I use) and the TOU plan (which I do not). Note that peak electricity represents only a small fraction of total consumption (15%). This reflects: (1) only 4 months include peak times, (2) those times are only 6 out of 24 hours a day and (3) weekends are excluded entirely. As indicated above, (1) and (2) make sense given my data; I don’t know whether the exclusion of weekends from peak hours (consistent across all states I have seen) is a function of actual peak consumption being lower on weekends, or a matter of customer accommodation.
Since peak electricity costs 2.5x the fixed rate, while off-peak reflects only a 35% discount, the 15%-85% split results in approximate parity, although with several hundred dollars of improvement over the year (about 5%). If my family had the incentive to save more money in reality, we likely would have further shifted our air conditioning usage outside of the 1pm - 7pm window on summer weekdays.
| Time of Use | Fixed Rate | |||
|---|---|---|---|---|
| Peak | Off-Peak | Total | Total | |
| Usage (kWh) | 3,951 | 26,357 | 30,314 | 30,314 |
| Est. Cost | $1,582.44 | $2,495.47 | $4,077.91 | $4,331.86 |
Analytical Notes
While this post’s analysis is very focused on my own data, the infrastructure developed here is quite extensible, and it is straightforward to apply my own data or others’ data to other state rate plans.