Thoughts on Electricity Storage
Energy storage – both home-scale and utility-scale – has become more relevant as the use of renewable energy for electricity generation proliferates. It is particularly topical recently, as the Inflation Reduction Act includes tax credits specifically targeting energy storage projects.
Energy storage (chemical batteries, pumped hydro storage, gravity-based batteries) transports electrical energy through time, from generation earlier to consumption later. Storage works when the aggregate amount of energy generated is adequate to satisfy aggregate demand, but there is a mismatch in the timing of supply and demand. Some basic fact patterns are:
- Demand More Variable than Supply. As discussed in previous posts, there is both a daily and a seasonal cycle to electricity usage. If a region’s generation is dominated by traditional base-load type power plants with high and constant generation capacity (nuclear, coal) or are quickly dispatchable (natural gas), there are two basic choices for meeting demand: either have enough generation capacity to cover the peak usage at any time, or marry sub-peak generation with the ability to store energy when demand is below supply and then release it for use when demand exceeds capacity.
- Supply More Variable through time than Demand. Supply can also be more variable than demand. Solar, for instance, generates electricity only during an 8-14 hour period during the daytime. The daily cycle of electricity usage varies but not this much: there is meaningful demand in the evening and through the night. So a grid with significant solar power will likely need to store daytime-generated energy to be deployed at night.
- Unplanned Intermittancy. A special case of supply variability: power outages due to storms or maintenance, or unfavorable weather conditions for solar / wind, can cause generation to temporarily fall short of demand.
This post will illustrate, using real-world electricity demand data and overly simplistic supply models (with no unplanned outages or weather intermittency) what profile of storage could be useful: how much energy capacity is needed and how frequently it is used. In all cases there will be a real-world question of whether it is more efficient to deploy capital in storage solutions or more generation capacity to compensate. A complete answer to that question is beyond the scope of this post, but my analysis provides some indication of feasibility of different architectures.
Here’s a summary:
-
In the constant generation model of traditional generation plants, it appears feasible to use battery storage to substitute for power generation that would cover the last ~10 - 20% of peak demand. Somewhat frustratingly, the strong variability of demand still means that this implies generation capacity that is adequate to supply more than 1.5 times the aggregate energy needs.
-
In a variable generation model like predominantly solar,1 there is some benefit in warm climates with mild winters from aligning higher summer generation with higher summer demand. But substantial storage is needed (probably more than is economical) to manage the day-night cycle. As with fixed generation however, there is so much variability of demand over time that the generation capacity measured in GWh needs to be a reasonable multiple of aggregate energy consumed.
- A combination, heavily weighted towards fixed, can get benefits of both fixed generation (no daily cycle) and solar (more generation with higher summer demand).
Analytical Approach
This post and the underlying code use the following analytical approach:
- We have access to electricity storage (e.g., battery storage). The battery can be “full” (its initial condition) and it can be drawn down in an arbitrarily large amount. In the model outputs below, a full battery is denoted by a zero value, and drawdowns are represented by negative quantities.
- Demand for electricity consumption is taken as a given as a function of time (measured hourly). Electricity, whether from the grid or from storage, must be supplied to meet that demand at all times.
- I can specify a maximum grid supply, also as a function of time (hourly).
- If the grid supply is inadequate to meet demand, the difference will be supplied by a drawdown of the balance in energy storage – making the storage balance more negative.
- If the supply exceeds demand at a given time, the excess will be used to “refill” the energy storage system up towards zero.
- If storage is full (zero) and there is more generation capacity during that hour than demand, generation is assumed to be turned down to match demand.
- Each scenario will then analyzed will be to identify how much battery capacity is actually needed, which can then be used to get a sense of feasibility.
Individual Home Scenarios
I’ll warm up with data for my own home in the Las Vegas area. To keep things simple, I only look at a single month (August 2021). This avoids the larger swings of demand between seasons.
Demand Variability: Storage to Replace Super-Peak Grid Usage
In the top chart below, the blue line shows my family’s electricity consumption by hour. Imagine I am limited to drawing a maximum level of power at any time from the grid. For example, this might be the median of each day’s peak hourly usage in the evening (red line; 11.5 kW). This limitation could be driven by a utility plan that encourages me (through price incentives) or requires me (e.g., smart grid throttling) to avoid drawing excessive power at peak times to protect the grid.
If I want to use more than 11.5 kW at any time, I must use a home battery system with previously-stored energy to make up the difference. So the red line in the bottom chart shows how much aggregate must be drawn from the full battery (y = 0).
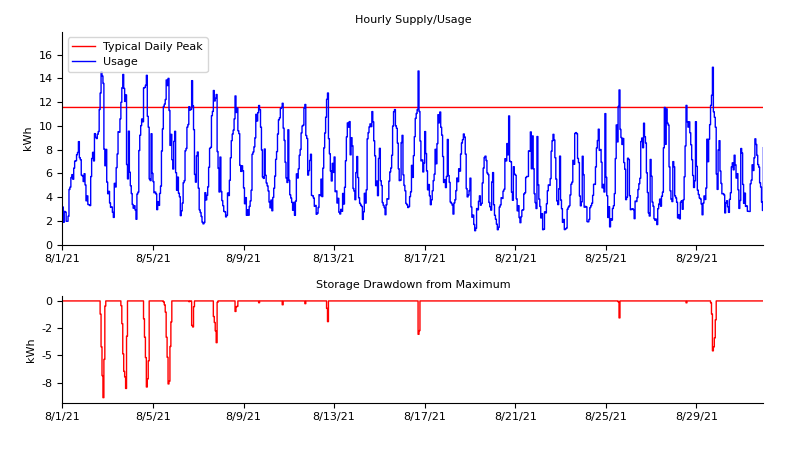
Since the grid supplies enough power to cover usage for all but a few hours a day on 15 days, a battery can readily fill the gap. For example, on August 3, air-conditioning driven demand exceeds supply from 2pm to 8pm by between 1 - 3 kWh per hour. By 8pm, the battery would have needed to supply a total of 8.05 kWh. Once the sun sets, hourly usage falls to under 7 kWh, and the excess up to 11.5 kWh refills the battery by 10pm.
Across the entire month, the largest daily battery usage would have been 8.9 kWh (on August 2). There are a number of home battery storage products available in the 10-20 kWh capacity area, so this solution seems feasible. However, at a battery cost for this capacity in the $10,000 - $15,000 range, it may not be an economical solution based on current prices, absent a hard supply constraint at the grid level.2
Supply Variability: Solar Power
Any electricity architecture that relies heavily on solar power needs storage. Even if solar generates enough electricity in aggregate over time, energy needs to be time shifted from the daytime, when the sun is shining, to nighttime. A motivating example is whether it is possible to use a combination of solar plus battery to supply a home’s electricity needs and go “off the grid”.
The below analysis assumes the same relative output throughout an August day in Nevada as explored in the last post, but scaled proportionally down so that the total output over the month is either 110% or 130% of the total electricity consumed in the month. Note that this generation function is ideal solar generation: the system generates electricity assuming good weather and no interruptions.3
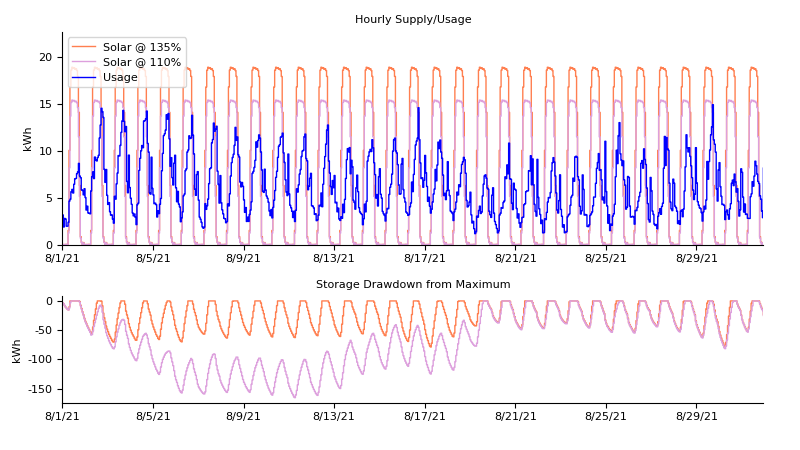
Notice the daily cycle: solar generation is strongest at mid-day, when the need for air conditioning has not yet ramped up, so at point the battery is filling. But generation drops by 50% in the 6-7pm hour, then falls away entirely. Meanwhile, the air conditioning peak generally runs until at least 8pm, so there is a sharp drawdown from storage in the evening that continues at a slower pace until the next morning.
An extra complication is that daily demand fluctuates considerably with both behavior (e.g., laundry and electric oven use) and weather (temperature / AC needs). Compared to an average of 148 kWh, daily use ranged from 99 kWh (67% of average) to 193 kWh (130% of average), just in one month. So in order for the battery to fully recharge every day, we need a solar generation system that was capable of delivering more than 130% the average day’s consumption every day. Using a 135% generation level (orange curve), the energy storage needs to be at least 79 kWh. This is a much larger and more expensive battery but still in the range of quasi-mass production: many electric vehicle batteries fall in the capacity range of 80-120 kWh.
If, however, our solar panels can only deliver 110% of the average day’s consumption (pink lines), we run into trouble. The beginning of August 2021 was hot and saw a number of consecutive days with usage greater than 110% of average, so day-to-day the battery never had a chance to recharge fully. The result was a bigger and bigger drawdown of storage capacity until the middle of the month. The total size of battery needed was at least 166 kWh.
On the other side, increasing solar generation beyond 135% of total consumption does not help much, since energy to be used at night needs to be stored, no matter how much is available during the day. For example, solar generation capacity of 200% of total use only reduces the storage needs to 74 kWh.
Finally, all of this ignores two real-world complexities: (1) seasonality (with much larger swings in demand and, for solar, supply) and (2) weather-driven shortfalls. If we take into account the likelihood that solar generation is not only lower than ideal (in Nevada, 82%), but lower in lumpy ways (i.e., some days with only 50% or less of ideal production), then storage capacity will have to be considerably higher to get through those days.
State-Level Grid Analysis
I now step back and consider the grid-scale question of how storage might economize on generation capacity by looking at the EIA’s total demand data for Nevada. I cover a full one-year period to capture the challenges arising from seasonality.4. We’ll begin with an assumption of fixed generation capacity.
Demand Variability: Storage to Replace Super-Peak Grid Usage
The U.S. grid right now is roughly set up such that generating capacity is approximately capable of handling maximum demand, with the caveat that regional balancing authorities import power from other reasons to meet peaks. For example, where Nevada’s summer electricity demand is 1.8x the spring/fall usage, the state in July/August 2022 imported an average of 1.5 GWh every hour (often 2+ GWh during the afternoon).
Storage offers an alternative. If generation can supply all of the grid’s consumption at most times, and most of the consumption at the rest, the excess on days with a few hours of peak demand that are a little bit higher can be powered from stored electricity. In this first example, I assume generation capacity at two levels:
-
The average of the daily consumption peaks during the 4 peak summer months (June to September), equal to 163% of the full-year average (i.e., enough to supply 163% of the full year consumption if always on), and 81% of peak
-
The 95th percentile among the 365 “peak hour” consumptions for each day in the year. This is 186% of average consumption, and 93% of the maximum peak hour.
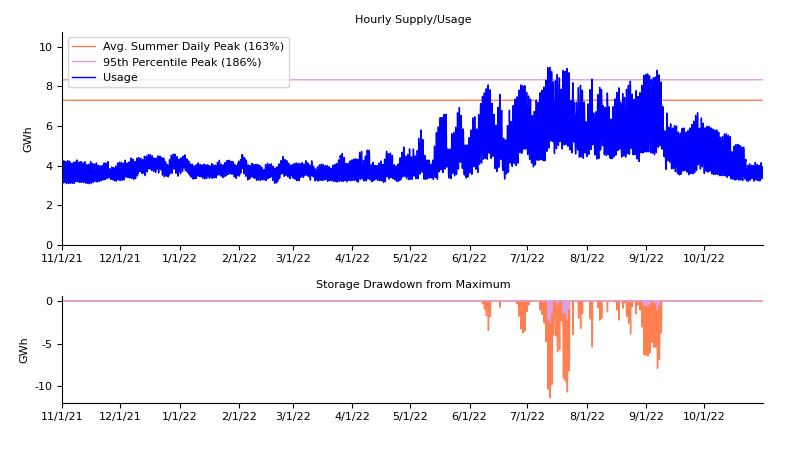
Because these supply levels are close to peak consumption, with consumption only exceeding these levels for at most a few hours a day in the summer, the hypothetical battery storage is always able to fully recharge every day (like the 135% solar example above). Thus the maximum demand on storage is simply how far above the supply level the consumption gets on each day, for how many hours:
| Total (GWh) | Average Hourly (GWh/h) | Peak Hourly (GWh/h) | # Days with Non-Zero Storage | # Days with Demand > Demand | Storage Needed | |||
|---|---|---|---|---|---|---|---|---|
| Demand | 39,292 | 4.49 | 100% | 8.97 | 100% | -- | -- | -- |
| Average Summer Peak | 64,115 | 7.30 | 163% | 7.30 | 82% | 68 | 0 | 11.4 GWh |
| Year's 95th %ile Peak | 73,224 | 8.34 | 186% | 8.34 | 93% | 18 | 0 | 2.6 GWh |
The results of these plans seem very feasible, especially higher-generation grid architecture. This could get by with 3 GWh of storage (delivered at a 0.7 GW rate, the difference between 9 GW peak demand and 8.3 GW supply). There are numerous pumped-hydro storage facilities in the U.S. that can store 10 GWh5. More modern chemical or gravity/weight based storage projects are, as of 2022, in the range of 250 - 500 MWh per project, and a few of these would cover the 3 GWh need. While never falling short over a 24-hour period, the average-summer-peak architecture falls behind a bit more summer afternoons, requiring 12 GWh of storage.
I interpret this as follows: 3 GWh of electricity storage would enable Nevada to eliminate about ~600 MW of electricity generation capacity (8.97 peak consumption vs. 8.34 fixed generation) or the equivalent in inter-region transfers. 12 GWh of storage would enable Nevada to eliminate ~1.6 GW of electricity generation capacity (or market transfers), larger than the largest natural gas power plants in the state at 1.1 GW each. This may deliver real value to the grid, especially if inter-region transfers become less reliable.
Limits of Replacing Peak Generation with Storage
Feasibility decays when fixed generation falls to levels where there are numerous consecutive days with daily total consumption in excess of generation levels. In these scenarios, storage does not refill daily, and there are accumulating drawdowns as time progresses. In Nevada, in a grid model based on traditional generation sources with constant capacity (Nuclear, Coal, Gas), the risk of this occurring is in the summer. To illustrate this effect, the chart below (1) eliminates the hourly variability to display daily totals and (2) plots the storage results for fixed generation at levels equal to 150% and 135% of the full-year average (i.e., if always on, enough to supply 1.5x / 1.35x the total annual consumption).
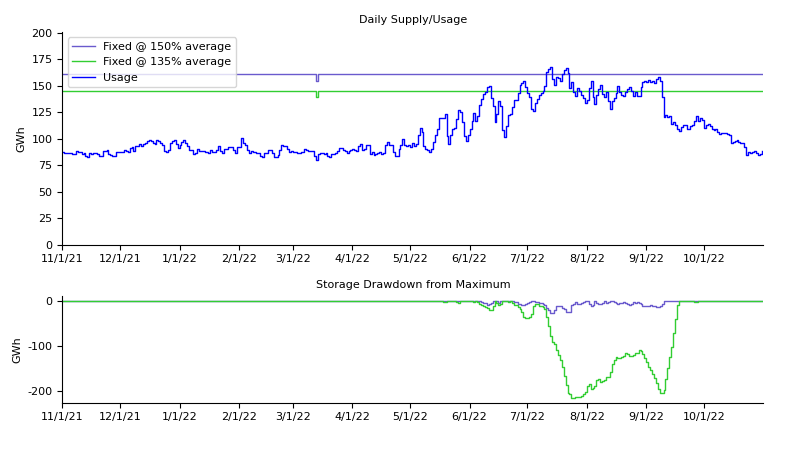
Note: This chart switches to plotting daily aggregate generation and usage quantities, to improve visibility. The underlying analysis remains hourly, however, and the bottom storage drawdown chart shows the maximum storage need on the indicated day.
In the 150% case (fixed supply of 6.73 GWh / h), there are many days in the summer where the afternoon and evening exceed consumption this (up to 8.97 GWh at the highest peaks). Thus many summer days see electricity storage drawdowns on the order of 10 GWh per day, as high afternoon demand uses storage that is refilled at lower-demand nighttime and morning. There are a few days in July where 24-hour usage exceeded 24h x 6.73 GWh / h = 161.5 GWh, causing storage use to increase day-over-day, reaching a maximum of 28 GWh. This is a large number but given the size of existing projects, may be feasible.
If generation is reduced to 135% of average, there are more than a month worth of days with consumption in exceeding supply and storage not refilling. This balloons the storage requirement to a very challenging 216 GWh.
| Total (GWh) | Average Hourly (GWh/h) | Peak Hourly (GWh/h) | # Days with Non-Zero Storage | # Days with Demand > Supply | Storage Needed | |||
|---|---|---|---|---|---|---|---|---|
| Demand | 39,292 | 4.49 | 100% | 8.97 | 100% | -- | -- | -- |
| Fixed Generation 150% | 58,938 | 6.73 | 150% | 6.73 | 75% | 87 | 7 | 27.5 GWh |
| Fixed Generation 135% | 53,045 | 6.06 | 135% | 6.06 | 68% | 116 | 41 | 215.6 GWh |
Solar: Some Helpful Supply Variability, Some Costly
Solar generates more power in the summer than in the winter, a fact that might be employed to address the feature of constant (but sub-peak) generation that there can be too little supply during the summer but more than enough in the winter, at least in a place like Nevada without much of a winter heating electricity consumption uptick.
The below model assumes generation at ideal solar capacity throughout the year, scaled to produce 150% and 135%, respectively, of annual average consumption.
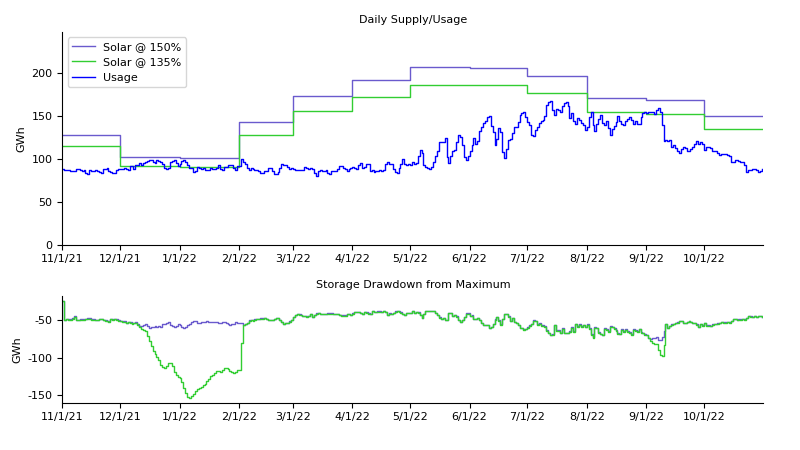
The 150% profile shows that seasonal alignment of supply and demand can have some value. In the fixed model, there were seven summer days without enough total power generation. Here, on all days the 24-hour ideal solar capacity exceeds 24-hour demand. There is no accumulation of storage requirement from one day to the next.
But an all-solar model has an irreducible – and very large – storage need to simple transfer energy from daytime production to nighttime use. At 150%, this quantity is 76.4 GWh, and doubling solar generation capacity again only reduces the requirement to 74 GWh.
| Total (GWh) | Average Hourly (GWh/h) | Peak Hourly (GWh/h) | # Days with Non-Zero Storage | # Days with Demand > Supply | Storage Needed | ||
|---|---|---|---|---|---|---|---|
| Demand | 39,292 | 4.49 | 100% | 8.97 | -- | -- | -- |
| Solar 150% | 58,938 | 6.73 | 150% | 18.03 | 365 | 0 | 76.4 GWh |
| Solar 135% | 53,045 | 6.06 | 135% | 16.22 | 365 | 40 | 153.1 GWh |
The 135% generation profile also carries some lessons. Like the 150% case, we have the daily cycles to the tune of 50 - 75 GWh per day. But with lower capacity we again have a number of days where the total usage exceeds total supply. Now this shortfall is not in the summer because increased solar production covers that increase in demand. Rather it is in winter when solar supply falls even more than electricity usage does. This phenomenon would be exacerbated in climates where winter electricity consumption increases (e.g., for electric heat) while solar generation falls.
The graph also demonstrates that the seasonality of solar electricity supply does not quite match the seasonality of electricity demand. Temperature lags the solar calendar by about a month because the atmosphere takes time to warm up and cool down. This is why in the northern hemisphere the hottest weather arrives in July and August, a month after the summer solstice. HVAC electricity usage follows temperature, so peak consumption occurs in July through September, when the solar output has begun to fall from early summer peaks.
Solar / Fixed Blend:
Finally I end with a blend: mostly fixed generation (Nuclear, Coal, Gas) to limit the magnitude of the daily time-shift cycles, with some solar generation so that we get a bit more power in the summer when demand is highest. The chart below shows a total generation capacity of 150% of the full-year aggregate, with 80% fixed / 20% solar.
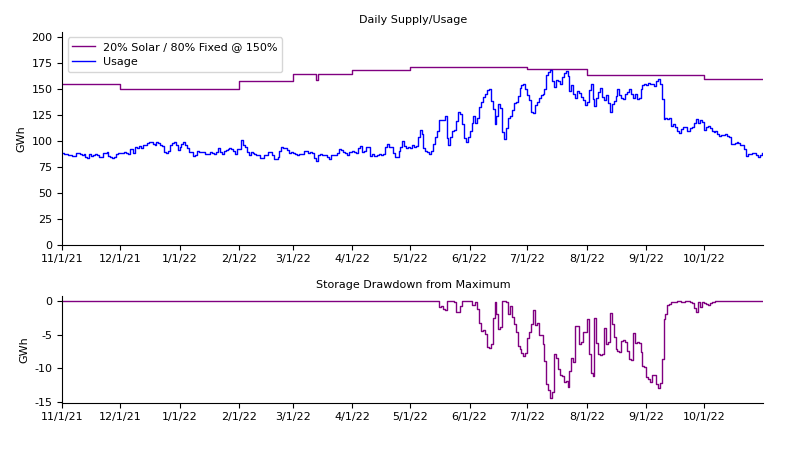
This model works reasonably well. Compared to the all-fixed 150% generation model needing 27.5 GWh of storage (summer strain) and 150% solar needing 73.8 GWh (big daily time-shift), the blended model requires only 14.4 GWh of storage, bringing the requirement into the zone of potentially feasible capital costs.
| Total (GWh) | Average Hourly (GWh/h) | Peak Hourly (GWh/h) | # Days with Non-Zero Storage | Days with Demand > Supply | Storage Needed | ||
|---|---|---|---|---|---|---|---|
| Demand | 39,292 | 100% | 4.49 | 8.97 | -- | -- | -- |
| 20% Solar / 80% Fixed @ 150% | 58,938 | 150% | 6.73 | 18.03 | 133 | 0 | 14.4 GWh |
A solar ratio of 20% turns out to be a bit of a sweet spot, at least at the 150% average generation level. At lower fractions, we don’t get enough of a lift of generation capacity from more sun in the summer to match higher electricity demand in summer. At higher fractions, the fixed portion of the generation portfolio becomes too low to supply evening / overnight consumption, and the daytime to nighttime storage requirements get bigger.
And, while not modeled, keeping weather-dependent generation to a small fraction of the total provides valuable grid reliability.
Limits of the Modeling Exercise
As always, this work is meant to be illustrative rather than complete, and it is important to bear key limitations in mind:
- The analysis in this post (and my data) had hourly granularity when in reality demand and supply need to be balanced constantly
- I assume a frictionless universe, without real world physical constraints such as transmission required when generation and consumption are not in the same place. I also assume that storage solutions can output 100% of the energy stored into them; ~80% is more realistic
- I measure only whether there is adequate energy in GWh to go around, and ignore the importance of voltage stability to the grid
- I make no effort to take into account fuel costs, operating costs or capital costs of storage and generation alternatives
- I ignored intermittency and weather-related outages
- Different climates have different seasonality profiles (and geographies) and will need different grid and storage architectures
I will aim to address some of these points in future work.
-
This post ignores wind power, which is too unpredictable for me to handle at this time. ↩
-
At the rates described in this post, the transfering 8 kWh from peak to off-peak times (a savings of $0.31 per kWh) every day day during NV Energy’s 4 peak summer months represents $300 a year of savings, so the breakeven on this size battery is measured in decades. ↩
-
Eagle-eyed readers of the last post can see that in some months (including August) overnight solar generation was non-zero. The ideal solar generation capacity data is taken from statewide Nevada grid-level solar generation data from the EIA, and there are a number of days in the 2022 data set with up to ~110 MWh of solar generation per hour in the nighttime hours (a bit over 5% of maximum daytime generation). This is probably not an anomaly, as there is a 110 MWh (!) thermal solar with attached storage system that can generate round-the-clock electricity in Tonopah, NV, whose months of operation correspond to months with non-zero solar generation. A generation facility that incororates its own storage muddies the waters for determining how much storage is needed in a solar-based system. Thus I have subtracted a constant amount of generation from all hours equal to the overnight minimum, and used that as the ideal solar generation function for this post. ↩
-
I use 1-Nov-21 to 1-Nov-22 to avoid the analytical period beginning or ending in either a summer or winter peak / trough of supply or demand. ↩
-
The Ludington Pumped Storage Power Plant in Michigan, for example, has a storage capacity of 19.5 GWh. The Northfield Mountain facility in Massachusetts can store around ~10 GWh. ↩